
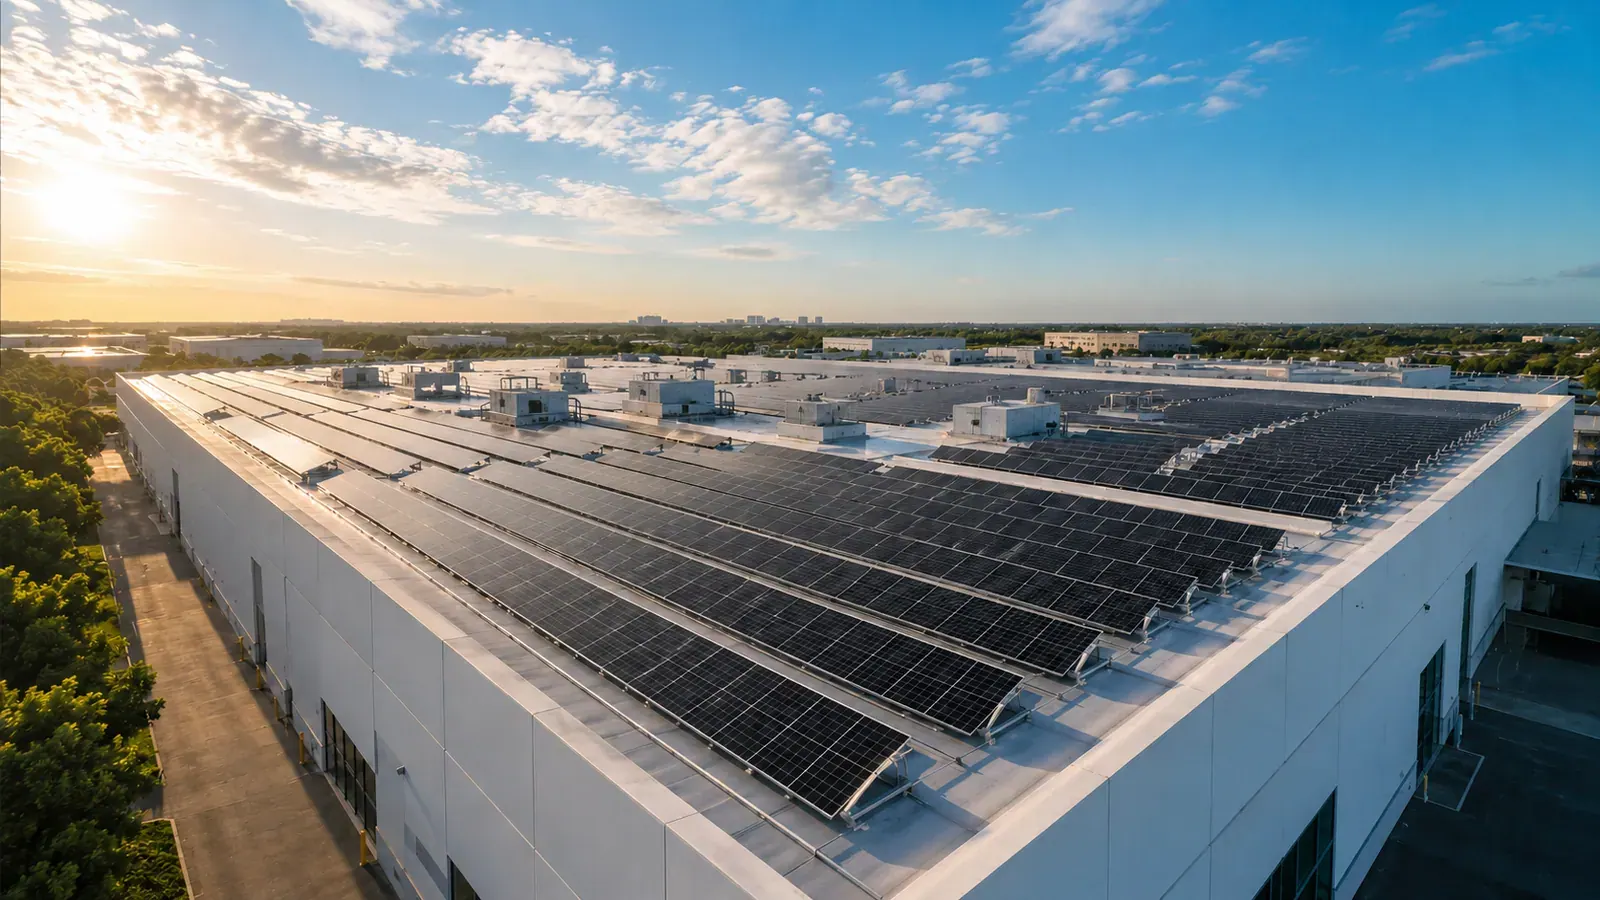
Solar panel efficiency tells you how much electrical power a module can produce from a given amount of sunlight and module area. For B2B buyers, the practical value of higher efficiency is not simply “more kWh from the same 100 kWp system.” Its main advantages are higher power density, more installable capacity on space-constrained sites, fewer modules for a target system size, and potentially lower balance-of-system (BOS) costs.
This guide explains the solar panel efficiency formula, module efficiency vs cell efficiency, STC/PTC/NOCT ratings, temperature coefficients, low-light and bifacial performance, project-yield calculations, and the specifications EPC contractors and procurement managers should include in an RFQ.
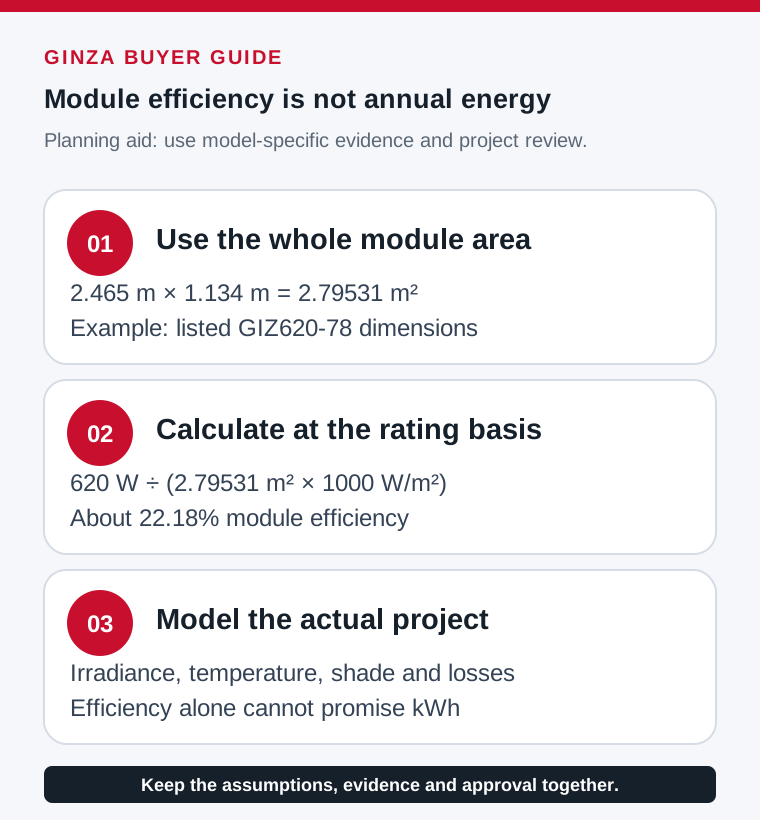
Key Takeaways
- Module efficiency is a power-density metric. It tells buyers how much nameplate power fits into a given module area.
- Use the finished module area in the formula. Cell efficiency and module efficiency are not interchangeable.
- Higher efficiency does not automatically increase kWh from a fixed-kWp system. Its largest benefit appears when roof or land area, module count, labor or structure is constrained.
- Check more than the headline percentage. Temperature coefficient, degradation, bifaciality, low-light data, warranty, certification and batch traceability can materially change project value.
- Treat supplier values as model-specific. Recalculate efficiency from Pmax and dimensions and verify every contractual value against the current approved datasheet.
What Is Solar Panel Efficiency?
Solar panel efficiency is the percentage of incident solar energy that a photovoltaic module converts into electrical power under defined test conditions. A module with 22% efficiency converts 22% of the incident solar power falling on its total module area into DC electrical power at the specified test point.
For procurement, module efficiency is the relevant number because it describes the complete product you buy. Cell efficiency is useful for understanding technology potential, but it does not represent the power density of the finished module.
Module Efficiency vs Cell Efficiency
The distinction matters because the same efficiency formula can describe either a cell or a module depending on which area is used.
| Parameter | Cell Efficiency | Module Efficiency |
|---|---|---|
| Definition | Efficiency of the active solar cell | Efficiency of the complete module |
| Area Used in Formula | Active cell area | Total module area |
| Includes Cell Gaps / Frame Area | No | Yes |
| Includes Interconnection / Optical Losses | Limited | Yes, at module level |
| Main B2B Use | Technology comparison | RFQ, layout and power-density comparison |
| Procurement Priority | Secondary | Primary |
Module efficiency is typically lower than cell efficiency because the finished module includes inactive spacing, interconnection losses, optical losses and non-active area. However, there is no universal fixed “2–4 percentage-point” gap for every design.
B2B rule: compare module efficiency and W/m², not an advertised laboratory cell-efficiency number.
How Solar Panel Efficiency Is Measured
The most common nameplate reference is STC — Standard Test Conditions:
- Irradiance: 1,000 W/m²
- Cell temperature: 25°C
- Solar spectrum: AM1.5
STC is a standardized laboratory reference, not a prediction of field energy yield. In real projects, irradiance, module temperature, wind, shading, soiling, wiring losses, inverter losses and system availability all change the delivered energy. The US Department of Energy also notes that PV conversion efficiency is measured under controlled light and cell-temperature conditions and that higher temperature generally reduces voltage and performance (DOE: Solar Performance and Efficiency Basics).
For a deeper explanation of why N-type cells are increasingly used in high-efficiency modules, see our N-Type Solar Panel Guide.
Solar Panel Efficiency Formula and Calculation
The solar panel efficiency formula is:
η (%) = Pmax / (A × G) × 100
Where:
- η = efficiency (%)
- Pmax = maximum DC power at the test point (W)
- A = area used in the calculation (m²)
- G = irradiance (W/m²)
At STC, G = 1,000 W/m².
The formula does not automatically calculate “cell efficiency” or “module efficiency.” If you use total module dimensions for area, the result is module efficiency. If you use active cell area, the result is cell efficiency.
Step-by-Step Module Efficiency Example
Assume a commercial module has:
- Rated power: 600 W
- Total module area: 2.50 m²
- STC irradiance: 1,000 W/m²
Calculation:
Efficiency = 600 / (2.50 × 1,000) × 100 = 24.0%
This is a 24.0% module efficiency because the total module area was used.
Quick Solar Panel Efficiency Calculator
For a datasheet check, use:
Module efficiency (%) = Pmax ÷ (Length × Width × 1,000) × 100
Use length and width in meters.
Example:
- Length = 2.50 m
- Width = 1.00 m
- Pmax = 600 W
600 ÷ (2.50 × 1.00 × 1,000) × 100 = 24.0%
If your calculated result differs materially from the datasheet value, verify whether the dimensions, power bin, bifacial rating or test basis are different.
Efficiency Formula vs Energy-Yield Formula
Efficiency and energy yield are related, but they are not the same calculation.
For project energy:
Annual energy (kWh) ≈ System size (kWp) × Peak sun hours/day × 365 × Performance Ratio
or:
Annual energy (kWh) = System size (kWp) × Specific yield (kWh/kWp/year)
Example for a 100 kWp system:
- Peak sun hours: 5.5 h/day
- Performance Ratio: 0.80
- Specific yield: 5.5 × 365 × 0.80 = 1,606 kWh/kWp/year
- Annual generation: 100 × 1,606 = 160,600 kWh/year
This calculation is site- and system-dependent. Module efficiency alone does not set the kWh/kWp value.
What Does a 1 Percentage-Point Efficiency Increase Mean?
A change from 20% to 21% is a 1 percentage-point absolute increase, but a 5% relative increase in power density:
21 ÷ 20 = 1.05
Likewise:
- 20% → 22% = 10% more power per module area
- 20% → 24% = 20% more power per module area
- 22% → 24% = 9.1% more power per module area
This distinction is important when estimating the economic value of higher-efficiency modules.
Understanding Solar Panel Efficiency Ratings on Spec Sheets
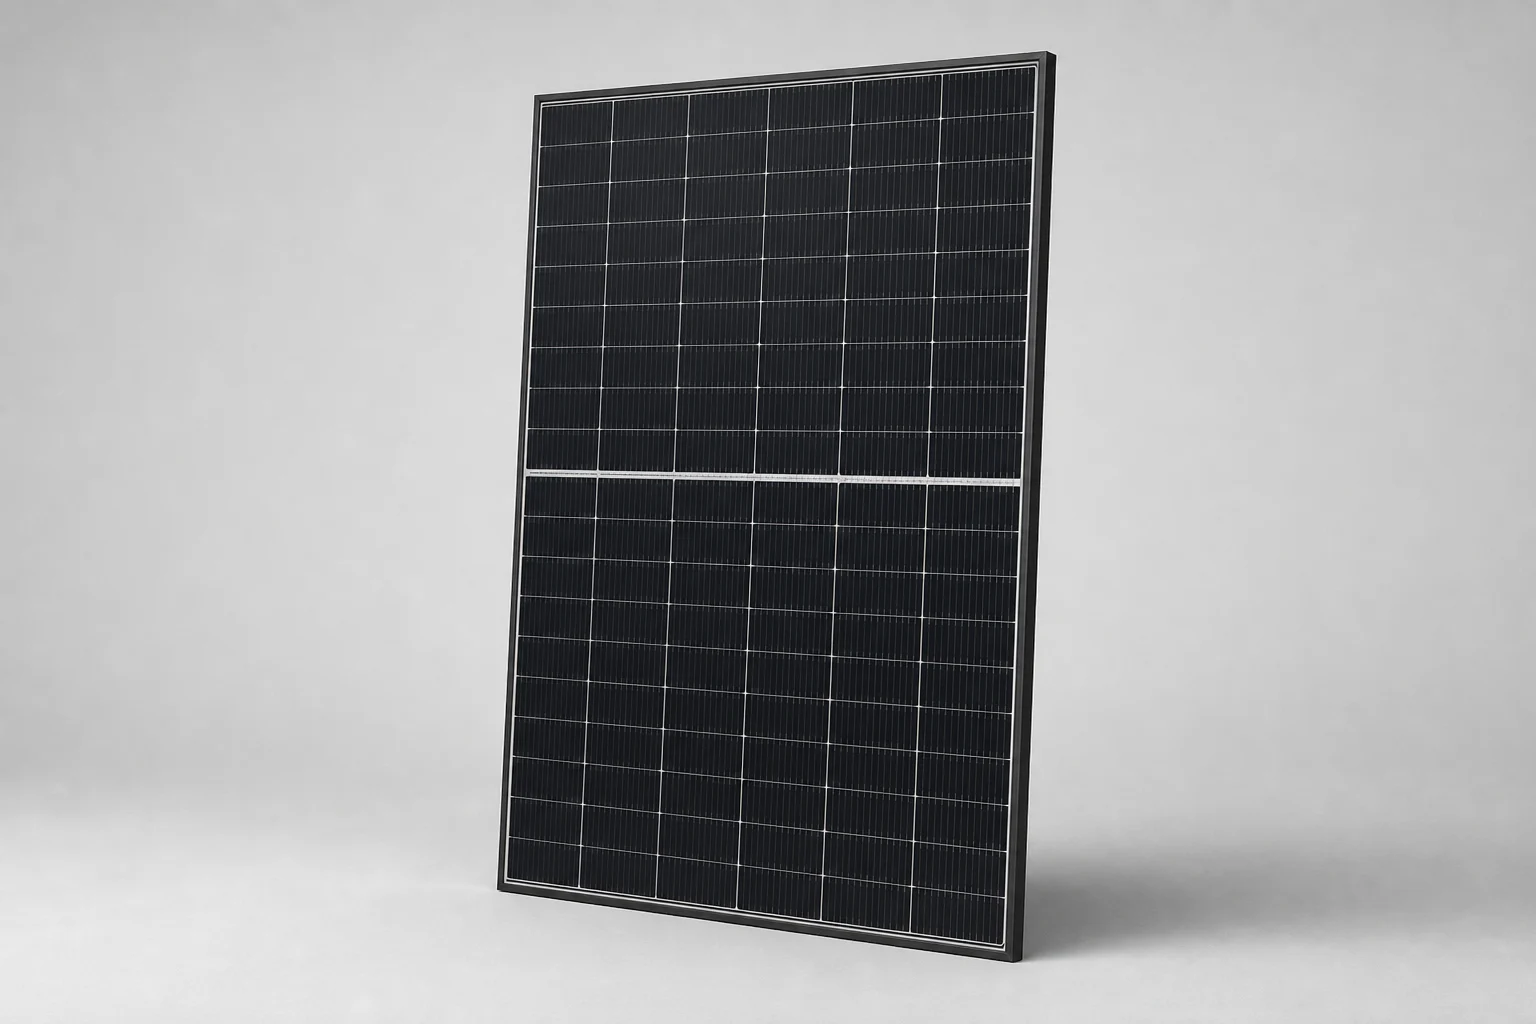
To verify a solar panel efficiency rating, check the STC Pmax and the full module dimensions, then calculate:
Module efficiency = Pmax / (Length × Width × 1,000) × 100
Do not stop at module efficiency. A B2B datasheet review should also include temperature coefficient, power tolerance, NOCT/NMOT data, Voc, Isc, Vmpp, Impp, degradation warranty and, for bifacial products, bifaciality.
STC, PTC, NOCT and NMOT: What They Actually Tell You
These terms are often grouped together, but they are not identical types of ratings.
| Metric | Reference Conditions | What It Tells You | B2B Use |
|---|---|---|---|
| STC | 1,000 W/m², 25°C cell, AM1.5 | Standardized nameplate power | RFQ baseline and cross-brand comparison |
| PTC | 1,000 W/m², 20°C ambient, 1 m/s wind | More field-like power rating than STC | Useful for realistic DC power comparison, especially in the US |
| NOCT | 800 W/m², 20°C ambient, 1 m/s wind; operating cell temperature is measured | Thermal operating behavior | Estimate module temperature under outdoor conditions |
| NMOT | Similar operating reference concept under newer IEC practice | Module operating temperature near maximum-power operation | Modern thermal-performance comparison |
A common mistake is to write “NOCT cell temperature = 20°C.” That is incorrect. 20°C is the ambient reference condition; the resulting operating cell/module temperature is higher and is the parameter being characterized.
PTC also uses a 20°C ambient reference, but module temperature is not fixed at 20°C.
Key Efficiency-Related Datasheet Parameters
| Parameter | Meaning | Procurement Check |
|---|---|---|
| Pmax | Rated maximum power at STC | Confirm power bin and tolerance |
| Module Efficiency | Power conversion per total module area | Compare W/m² across models |
| Temperature Coefficient of Pmax | Power change as cell temperature rises | Closer to zero is better |
| Power Tolerance | Allowed production deviation from nameplate | Prefer positive-only tolerance |
| Voc | Open-circuit voltage | Check maximum string voltage |
| Isc | Short-circuit current | Cable, fuse and inverter input design |
| Vmpp / Impp | Maximum-power-point voltage/current | MPPT and string design |
| NOCT / NMOT | Thermal operating behavior | Hot-climate yield modeling |
| Low-Irradiance Data | Output behavior below STC irradiance | Cloudy/rainy-season modeling |
| Bifaciality | Rear-side response relative to front side | Relevant for bifacial projects |
| Degradation Warranty | Guaranteed long-term output | Financial model and bankability |
Temperature Coefficient: Read the Sign Correctly
A Pmax temperature coefficient of -0.29%/°C is better than -0.35%/°C because it is less negative.
For procurement language, write:
- “Pmax temperature coefficient no worse than -0.35%/°C”, or
- mathematically, Pmax coefficient ≥ -0.35%/°C
Do not write “≤ -0.35%/°C” if your intention is to demand better hot-temperature performance, because -0.38%/°C would satisfy that mathematical condition even though it is worse.
Power Tolerance: Check W vs %
Many modules specify positive power tolerance in watts, such as 0 to +5 W, not +5%. A +5% tolerance on a 600 W module would equal +30 W, which is a very different specification.
Always copy the exact unit and tolerance format from the approved datasheet into the RFQ.
How to Verify Supplier Efficiency Claims
Before approving a supplier, use these checks:
- Recalculate module efficiency from Pmax and full module dimensions.
- Compare power density (W/m²) across suppliers.
- Review third-party test and certification documents applicable to your market.
- Request flash-test data for production batches.
- Request EL images or an EL sampling plan to identify microcracks and cell defects.
- Check serial-number traceability between flash data, EL records and shipped modules.
- Verify PAN or simulation files if the project will be modeled in PVsyst or equivalent software.
For a technology-level comparison, see our TOPCon vs PERC Solar Panel Guide.
Solar Panel Efficiency by Technology in 2026
As of August 2026, mainstream commercial PV has moved decisively toward N-type technologies. The latest public IEA PVPS industry material available for this review reports that N-type wafer share rose from 30% in 2023 to 70% in 2024 and describes TOPCon as the mainstream technology in 2024. This is historical industry evidence, not a universal 2026 module-shipment share (IEA PVPS industry trends presentation).
For B2B procurement, the best choice is not automatically the technology with the highest headline efficiency. Buyers should compare bankability, price, temperature behavior, bifaciality, degradation, supply scale, certification and project-specific power density.
Current Technology Comparison
| Technology | Typical Commercial Position | Efficiency Position | Relative Cost Position | B2B Fit |
|---|---|---|---|---|
| Mono PERC | Legacy / declining | Generally lower power density than current premium N-type modules | Lowest | Budget or legacy supply |
| N-type TOPCon | Mainstream | Broad commercial range; verify each model | Competitive | Default comparison point for many commercial projects |
| HJT | Premium N-type | High-efficiency option with strong temperature and bifacial potential | Higher | Hot climates, premium projects |
| Back Contact / IBC-type | Premium high-efficiency | Often positioned at the top end of commercial efficiency | Highest | Space-constrained / premium projects |
Market note: avoid locking procurement decisions to a single “market share percentage.” Market-share estimates vary by source, period, region and whether they measure wafer type, cell production or module shipments. Record the source, measurement basis and date whenever a share is quoted.
TOPCon
TOPCon combines high module efficiency, mature manufacturing scale, strong bifacial capability and competitive pricing. For many commercial rooftops, C&I projects and ground-mount projects, it offers the best overall balance of performance and procurement availability.
HJT
HJT is attractive where temperature performance and high bifaciality justify a premium. It is especially relevant to hot environments and projects where every square meter matters, but supplier scale and pricing should be evaluated carefully.
Back-Contact Technologies
Back-contact architectures move electrical contacts away from the illuminated front surface, improving active-area utilization and reducing front-side shading. They currently lead the commercial efficiency race, but a B2B buyer should evaluate the premium against the value of extra installable kWp.
Bifacial vs Monofacial: Efficiency or Energy Gain?
Bifacial modules do not necessarily have higher front-side module efficiency than an equivalent monofacial module. Their main advantage is additional rear-side energy capture.
That distinction matters:
- Module efficiency is normally quoted on the front-side STC rating.
- Bifaciality factor compares rear-side electrical response with front-side response.
- Bifacial gain is a project energy-yield increase produced by reflected light reaching the rear surface.
Bifacial Performance Comparison
| Parameter | Monofacial | Bifacial |
|---|---|---|
| Front-Side Efficiency | Depends on module design | Depends on module design |
| Rear-Side Generation | No | Yes |
| Bifaciality Factor | N/A | Supplier-specific |
| Energy Gain | Baseline | Site-dependent |
| Best Applications | Flush rooftops | Ground mount, carport, elevated roof, reflective surfaces |
| Key Design Variables | Tilt, shade | Tilt, height, row spacing, albedo, rear shading |
Typical bifacial energy gain can range from only a few percent to well above 10% in optimized installations. It should be modeled, not assumed.
Important variables include:
- Ground albedo
- Module elevation
- Row spacing
- Rear-side structural shading
- Torque-tube design
- White or reflective roof surfaces
- Tracker vs fixed-tilt layout
For applications where rear-side exposure can be optimized, see our Solar Carport Guide.
Real-World Factors That Reduce Output and Operating Efficiency
STC is a laboratory reference. Real-world energy output is affected by module temperature, irradiance, angle of incidence, shading, soiling, mismatch, degradation and system losses.
A critical technical distinction is that not every field loss should be called an “efficiency loss.” For example, lower irradiance during rain directly reduces available solar power; that is not the same as the module suddenly losing the same percentage of conversion efficiency.
Major Performance Factors
| Factor | Typical Effect | Procurement / Design Action |
|---|---|---|
| High Cell Temperature | Reduces Pmax according to temperature coefficient | Select a less-negative coefficient and model hot-cell temperature |
| Soiling | Site-dependent energy loss | Define cleaning strategy and O&M budget |
| Shading | Can range from minor to severe | Perform shade analysis and string design |
| Low Irradiance | Lower absolute power; conversion efficiency may also change | Review low-irradiance curves/test data |
| Mismatch | Reduces string output | Tight binning and quality control |
| PID Risk | Long-term power loss in susceptible systems | Specify PID testing where required |
| Degradation | Reduces long-term power | Compare warranty curves and technology |
| Inverter / Wiring Losses | System-level loss | Model separately from module efficiency |
Temperature: A Critical Hot-Climate Parameter
Solar-module Pmax typically decreases as cell temperature rises above 25°C.
Example at a 60°C cell temperature:
Temperature difference from STC:
60 – 25 = 35°C
For a module with -0.38%/°C:
35 × 0.38% = 13.3% power reduction
For a module with -0.29%/°C:
35 × 0.29% = 10.15% power reduction
The second module retains about 3.15 percentage points more rated power under this simplified temperature-only comparison.
For Southeast Asia, the Middle East, Africa and other hot regions, temperature coefficient should be treated as a primary project-yield input rather than a small datasheet detail.
Shading and Soiling
Partial shading is highly layout-dependent. Depending on string configuration, bypass-diode activation and shade pattern, losses can be far greater than the shaded area percentage.
For B2B projects:
- run a shade simulation before final layout,
- avoid inter-row and rooftop-obstruction shading,
- evaluate optimizers or module-level power electronics only where they provide measurable value,
- include realistic soiling assumptions in the energy model,
- define cleaning frequency from site conditions rather than using a universal schedule.
Rainy Season and Low-Light Performance
During rainy or heavily overcast periods, the main reason production drops is lower irradiance. It is misleading to say that a panel is simply “60% efficient” because seasonal output falls.
Instead, evaluate:
- Monthly site irradiance or TMY data
- Low-irradiance relative-efficiency curves
- Temperature changes during cloudy periods
- Shading and horizon effects
- Inverter MPPT operating range at low DC power
For projects in tropical markets, use location-specific weather data rather than a universal rainy-season percentage.
For long-term power decline, see our Solar Panel Degradation Guide.
How Solar Panel Efficiency Affects Project Energy Yield
The financial impact of efficiency depends on what is fixed in the project.
There are two different cases:
- Fixed system size (kWp): higher efficiency mainly reduces module area and module count.
- Fixed available area: higher efficiency lets you install more kWp, which can materially increase annual energy.
Confusing these two cases leads to incorrect ROI calculations.
Case 1: Fixed 100 kWp System
Assume identical site conditions and the same 1,606 kWh/kWp/year specific yield.
| Module Efficiency | Approx. Module Area Needed for 100 kWp | Installed DC Capacity | Base Annual Energy* |
|---|---|---|---|
| 20% | 500 m² | 100 kWp | 160,600 kWh |
| 22% | 455 m² | 100 kWp | 160,600 kWh |
| 24% | 417 m² | 100 kWp | 160,600 kWh |
| 25% | 400 m² | 100 kWp | 160,600 kWh |
*Before technology-specific differences in temperature behavior, bifacial gain, low-light response, mismatch, degradation and other losses.
Key point: a 24% module does not automatically create more energy than a 20% module when both systems are exactly 100 kWp and otherwise identical.
Its value is that the same 100 kWp requires less module area and often fewer modules.
Case 2: Fixed 1,000 m² of Usable Module Area
Now assume the project is area-constrained and the full 1,000 m² represents usable module aperture area for comparison.
| Module Efficiency | Approx. Installable DC Capacity | Annual Energy at 1,606 kWh/kWp | Annual Value at $0.10/kWh |
|---|---|---|---|
| 20% | 200 kWp | 321,200 kWh | $32,120 |
| 22% | 220 kWp | 353,320 kWh | $35,332 |
| 24% | 240 kWp | 385,440 kWh | $38,544 |
| 25% | 250 kWp | 401,500 kWh | $40,150 |
Moving from 20% to 24% efficiency increases power density by 20%, allowing about 40 kWp more DC capacity on the same module area.
At the assumptions above:
- Additional annual energy: 64,240 kWh
- Additional annual energy value at $0.10/kWh: $6,424
- Simple 25-year gross energy value before degradation, discounting and O&M effects: $160,600
This is the correct place to monetize higher module efficiency: space-constrained projects.
BOS Value of Higher Efficiency
Even without an area constraint, higher efficiency can reduce:
- Number of modules
- Clamp count
- Rail or support quantity
- Module-level connectors
- Installation labor
- Roof loading points
- Inspection points
- Transport volume for a target MW quantity
The magnitude depends on module wattage, dimensions, mounting system and project layout.
For procurement planning, compare $/W plus BOS impact, not module $/W alone.
A Better ROI Formula for High-Efficiency Modules
Avoid universal claims such as “high efficiency always pays back in 6–12 months.” The answer depends on the project.
A better procurement calculation is:
Incremental value =
– extra kWp enabled by the available area
– × annual specific yield
– × electricity value
– × discounted project life
plus
– BOS savings
– labor savings
– land/roof opportunity value
minus
– module price premium
– any additional design or supply-chain cost
This framework works for commercial rooftops, solar carports, utility projects and distributor procurement.
For a complete BOM perspective, see our Solar Project BOM Checklist.
How to Specify Solar Panel Efficiency in a B2B RFQ
A strong RFQ should define measurable requirements rather than simply asking for a “high-efficiency panel.”
For mainstream commercial procurement, the efficiency threshold should be chosen according to available area, project economics and current supplier offerings.
RFQ Efficiency Specification Template
| Specification | Example Standard Requirement | Example Premium Requirement | Why It Matters |
|---|---|---|---|
| Module Efficiency at STC | ≥22% | ≥24% or project-specific | Power density |
| Pmax Temperature Coefficient | No worse than -0.35%/°C | No worse than -0.30%/°C | Hot-climate output |
| Power Tolerance | Positive-only; specify exact unit | Tight positive-only range | Prevent under-nameplate supply |
| Year-1 Degradation | ≤2% | ≤1.5% | Initial performance |
| Annual Degradation Thereafter | ≤0.5%/yr | ≤0.3–0.4%/yr | Long-term yield |
| Product Warranty | Project-specific minimum | Extended warranty | Defect protection |
| Linear Power Warranty | 25–30 years | Strong retained-power guarantee | Financial model |
| NOCT / NMOT Data | Required | Required + supporting test data | Thermal modeling |
| Low-Irradiance Data | Provide | Provide test curves/data | Cloudy-period modeling |
| IEC Qualification | IEC 61215 + IEC 61730 | Same + market-specific requirements | Safety / design qualification |
| PID Test | If project requires | Include IEC TS 62804 evidence | High-voltage/humidity risk |
| Bifaciality | If bifacial module | Define minimum from datasheet | Rear-side modeling |
| Flash Data | Batch / serial level | 100% serial traceability | Incoming QC |
| EL Inspection | Sampling plan | Pre-shipment + receiving sampling | Crack / defect control |
Common Procurement Mistakes
1. Specifying Cell Efficiency Instead of Module Efficiency
Cell efficiency does not tell you the installed module power density. Always specify the finished-module value.
2. Using the Wrong Temperature-Coefficient Inequality
“≤ -0.35%/°C” mathematically allows worse values such as -0.38%/°C.
Use “no worse than -0.35%/°C” or ≥ -0.35%/°C.
3. Confusing +5 W With +5%
Read the unit. These are not equivalent.
4. Assuming Bifacial Gain Is Guaranteed
Bifacial gain is a system-design outcome. Require bifaciality data, then model site albedo and rear irradiance.
5. Comparing Only Nameplate Wattage
A 700 W module is not automatically more efficient than a 600 W module. Compare total area and W/m².
6. Treating Efficiency as kWh/kWp
Efficiency is primarily a power-density metric. Specific yield depends on site irradiance, temperature, orientation, losses and system design.
7. Not Verifying Batch Data
For large orders, include flash-test traceability, EL inspection requirements and acceptance sampling in the purchase specification.
Supplier Evaluation Checklist
| Check | Method | Red Flag |
|---|---|---|
| Module efficiency | Recalculate from Pmax and dimensions | Does not match datasheet |
| Power density | Compare W/m² | Lower than expected for claimed technology |
| Temperature coefficient | Compare Pmax coefficients | More negative than project requirement |
| Power tolerance | Verify unit and range | Negative tolerance or ambiguous unit |
| Certification | Verify report/certificate numbers | Unverifiable documents |
| Flash data | Serial-level or batch-level records | Only average-bin data |
| EL inspection | Defined sampling evidence | Supplier refuses to provide |
| Warranty | Review exact curve and exclusions | Marketing claim differs from legal warranty |
| Simulation files | PAN / model inputs | No validated performance file |
| Traceability | Serial / batch linkage | Cannot link records to shipped modules |
For inverter-side electrical matching after module selection, see our Solar Inverter Selection Guide.
GINZA Solar High-Efficiency TOPCon Panels
GINZA Solar lists N-type bifacial modules for B2B solar procurement in the 580–635 W class. The table below uses only values currently marked as confirmed on the public GINZA Solar panel page as reviewed on August 8, 2026. Electrical, mechanical, warranty and certification details remain model-specific and must be checked against the approved quotation datasheet.
GINZA Solar Product Specifications
| Public Product Listing | Power | Confirmed Module Efficiency | Dimensions | Data Status |
|---|---|---|---|---|
| GINZA 635 W N-type bifacial panel | 635 W | 22.71% | 2465 × 1134 × 30 mm | Confirmed on current product page |
| GINZA 620 W N-type bifacial panel | 620 W | 22.18% | 2465 × 1134 × 30 mm | Confirmed on current product page |
| GINZA 610 W N-type bifacial panel | 610 W | Not yet confirmed publicly | 2465 × 1134 × 30 mm | Confirm before quotation |
| GINZA 580 W N-type bifacial panel | 580 W | 22.45% | 2278 × 1134 × 30 mm | Confirmed on current product page |
Source: GINZA Solar confirmed N-type bifacial panel data. For RFQ use, confirm all model-specific values against the latest approved datasheet and certification package, especially dimensions, electrical values, power tolerance, temperature coefficient, bifaciality, warranty curve and certificate scope.
For B2B orders, MOQ, lead time, Incoterms, payment terms and project-specific availability should be quoted by model and destination rather than hard-coded into an evergreen technical article.
Explore GINZA Solar’s high-efficiency TOPCon panels or contact our sales team for current project specifications, pricing and availability.
FAQ — Solar Panel Efficiency for B2B Buyers
What is solar panel efficiency?
Solar panel efficiency is the percentage of incident solar power converted into DC electricity under defined test conditions. For procurement, use finished-module efficiency rather than cell efficiency because module efficiency reflects the total module area and is the relevant value for power-density and layout comparisons.
What is the solar panel efficiency formula?
Use:
Efficiency (%) = [Pmax / (Area × Irradiance)] × 100
At STC, irradiance is 1,000 W/m². A 600 W module with a total area of 2.50 m² has:
600 / (2.50 × 1,000) × 100 = 24.0% module efficiency.
What is a good solar panel efficiency rating in 2026?
For commercial procurement in 2026, a module at or above roughly 22% is a useful high-power-density comparison point, but there is no universal pass/fail threshold. Compare products available for the same project and module format, then verify cost, dimensions, warranty, temperature behavior, certification and available area.
What is the difference between module efficiency and cell efficiency?
Cell efficiency uses active cell area. Module efficiency uses the complete module area. Because a finished module includes cell spacing, interconnections and inactive areas, its efficiency is typically lower than the underlying cell efficiency. B2B RFQs should specify module efficiency.
How does temperature affect solar panel output?
The Pmax temperature coefficient describes how rated power changes as cell temperature rises. A coefficient of -0.29%/°C is better than -0.35%/°C because it is closer to zero. At 60°C cell temperature, those two coefficients imply about 10.15% and 12.25% power reduction respectively versus 25°C, before other losses.
How efficient are solar panels during rainy season?
Rainy-season production falls mainly because solar irradiance is lower, not because the module suddenly loses the same percentage of conversion efficiency. Use monthly irradiance, TMY weather data and supplier low-light curves to model rainy-season output accurately.
What is the most efficient type of solar panel in 2026?
Back-contact products are commonly positioned at the high-efficiency end of the commercial market, while TOPCon is the mainstream N-type comparison point and HJT remains a premium option. No architecture is automatically best for every project: use current model-level datasheets, price, temperature behavior, bifacial design, warranty and supply availability.
Does a higher-efficiency panel generate more kWh from the same 100 kWp system?
Not automatically. If two systems are both exactly 100 kWp and have identical site conditions and losses, module efficiency mainly changes the area and module count required. Higher efficiency creates more energy when it allows more kWp to be installed within a fixed area or when the technology also improves temperature, bifacial, low-light or degradation performance.
How do I calculate solar-panel energy yield for a project?
Use:
Annual energy = system size (kWp) × annual specific yield (kWh/kWp/year)
or estimate specific yield from peak sun hours and Performance Ratio. For example, 5.5 peak sun hours/day and PR 0.80 gives approximately 1,606 kWh/kWp/year.
How do I read efficiency on a solar panel datasheet?
Check Pmax and total module dimensions, then calculate:
Efficiency = Pmax / (Length × Width × 1,000) × 100
Also review Pmax temperature coefficient, power tolerance, NOCT/NMOT, Voc, Isc, Vmpp, Impp, degradation warranty and bifaciality where applicable.
What efficiency should I specify in a solar-panel RFQ?
A typical commercial RFQ may require module efficiency ≥22%, a Pmax temperature coefficient no worse than -0.35%/°C, positive-only power tolerance with the exact unit stated, verified IEC 61215/61730 qualification, defined degradation limits and batch quality-control evidence. Tighten the requirements for space-constrained or premium projects.
What happens to solar panel efficiency after 10 years?
There is no single universal 10-year efficiency value. Long-term output depends on the module’s degradation rate, environment and warranty curve. Use the manufacturer’s guaranteed annual degradation and the project’s degradation model rather than assuming a fixed percentage. See our Solar Panel Degradation Guide for the full calculation method.
B2B Procurement Takeaway
For EPC contractors, distributors and project buyers, solar panel efficiency should be treated as a power-density and project-design variable, not as a standalone promise of higher kWh/kWp.
The strongest procurement process is to:
- verify module efficiency from Pmax and dimensions,
- compare W/m²,
- model temperature and site-specific losses,
- separate fixed-kWp and fixed-area economics,
- model bifacial gain instead of assuming it,
- specify measurable RFQ thresholds,
- verify batch-level flash, EL and traceability data,
- compare the module premium against added kWp, BOS savings and lifetime project value.
Higher efficiency is most valuable where roof area, land area, structural constraints or installation labor limit the project. In those cases, the correct question is not simply “Which panel has the highest efficiency?” but “How much additional bankable project value does each percentage point of module efficiency create at this site?”
Technical Reference Notes
- STC is based on 1,000 W/m² irradiance, 25°C cell temperature and AM1.5 spectrum.
- PTC uses 1,000 W/m² irradiance, 20°C ambient temperature and 1 m/s wind as a more field-like comparison basis.
- NOCT characterizes operating cell temperature around 800 W/m² irradiance, 20°C ambient and 1 m/s wind.
- The latest public IEA PVPS material reviewed for this article describes TOPCon as mainstream in 2024; the article does not convert that evidence into an unsupported universal 2026 shipment-share claim.
- Product-specific GINZA values in this article reflect the public panel page reviewed on August 8, 2026 and must be checked against the latest approved datasheet before contractual use.
Sources and Verification Date
- US Department of Energy — Solar Performance and Efficiency Basics
- IEA PVPS — Trends of PV Industry presentation
- GINZA Solar — Confirmed N-type bifacial panel data
Technical and product references were last reviewed on August 8, 2026. Recheck model-specific values before issuing an RFQ, purchase order or contractual specification.