
Solar Panel Degradation Rate at a Glance
Solar panel degradation is the gradual reduction in photovoltaic module power output over time. A widely cited long-term field benchmark is about 0.5% per year, but the correct number for procurement is not a single industry average: actual degradation depends on module design, bill of materials (BOM), climate, installation quality and operating conditions.
For EPC contractors and project buyers, three numbers should be separated in every technical evaluation:
- First-year degradation or stabilization loss
- Annual degradation after Year 1
- Guaranteed power at the end of the performance-warranty period
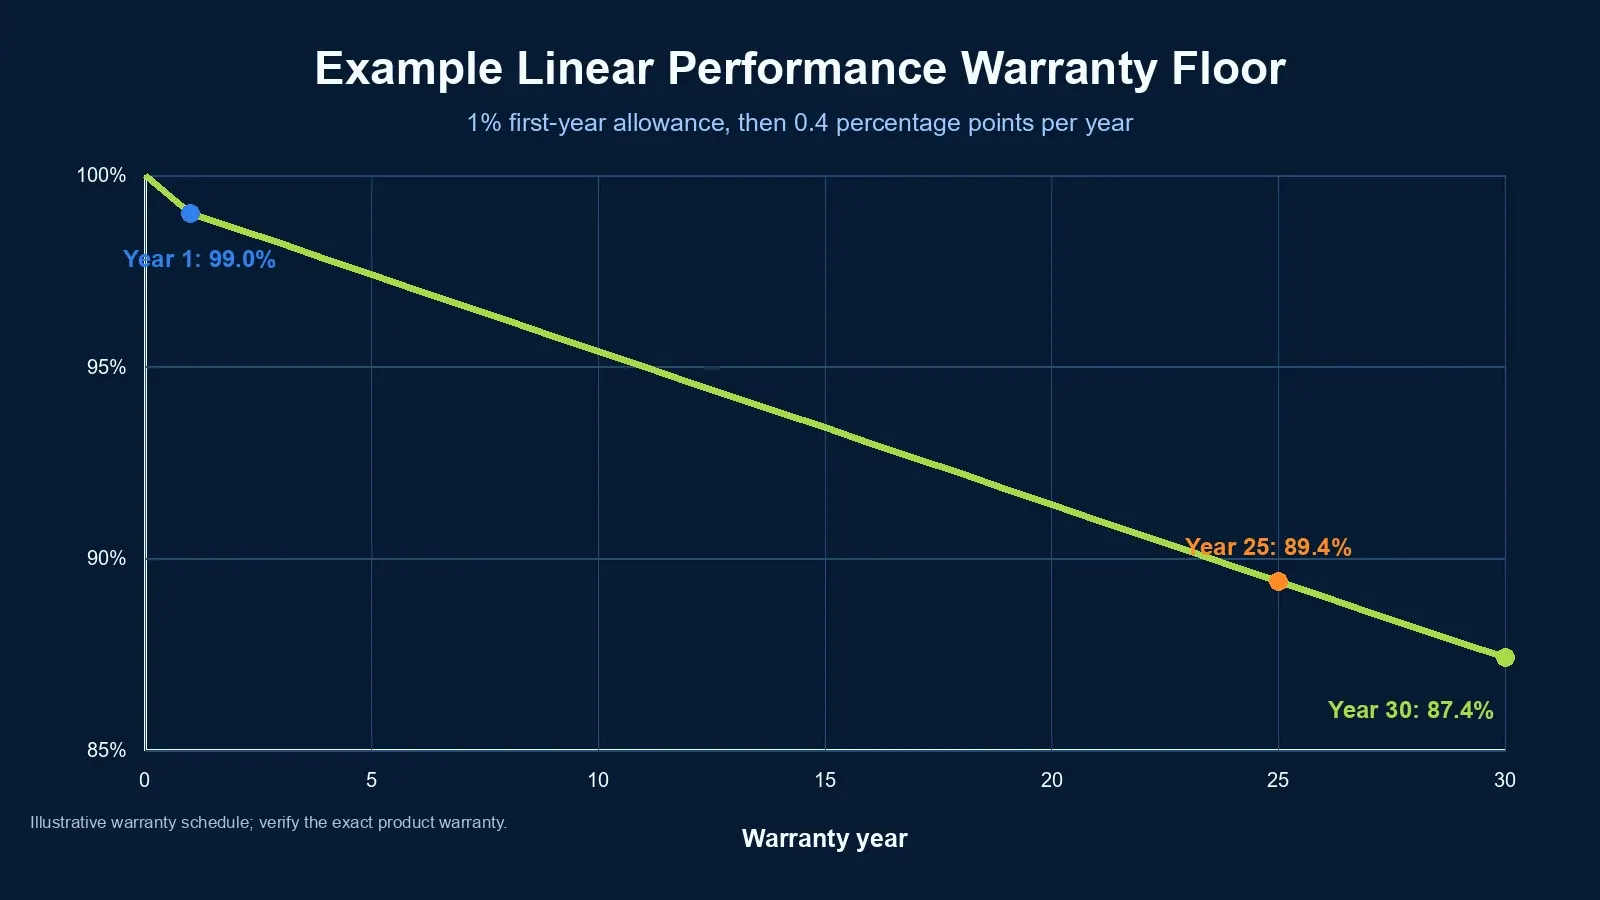
Modern module warranties often specify a first-year loss and then a linear annual decline. For example, an N-type TOPCon warranty may allow about 1% in Year 1 and 0.4 percentage points per year afterward, reaching about 87.4% at Year 30. That warranty curve is a contractual minimum, not a prediction that every module will degrade at exactly that rate.
| Procurement Question | What to Check |
|---|---|
| What is the solar panel degradation rate? | First-year limit + annual limit after Year 1 |
| Is the warranty linear? | Guaranteed minimum power for every year, not only selected milestone years |
| What does 87.4% mean? | Confirm whether it applies to Year 25 or Year 30 |
| Is the rate field-proven? | Separate long-term field evidence from accelerated tests and warranty promises |
| Is the module reliable in my climate? | Review TC, DH, PID, UVID, LID/LeTID and mechanical-stress results for the exact BOM |
For B2B projects, degradation affects lifetime energy yield, LCOE, revenue forecasts, warranty bankability and supplier selection. It should therefore be evaluated alongside module efficiency, price per watt, product warranty, reliability testing and manufacturer quality control.
Related reading: Solar Battery Lifespan Guide — battery and module degradation together influence system-level lifecycle economics.
What Is Solar Panel Degradation?
Solar panel degradation is the loss of a PV module's maximum power output as materials and electrical interfaces age under sunlight, voltage, temperature changes, humidity and mechanical stress. It is usually expressed as a percentage of nameplate power lost per year.
A historical NREL review of nearly 2,000 published field degradation rates reported a median of approximately 0.5%/year across technologies and climates. That number is useful as a long-term reference, but it should not be treated as the guaranteed rate for a modern TOPCon, HJT or PERC product.
Why? Because a solar module is not only a cell technology. Its field reliability also depends on:
- cell metallization and interconnection design;
- encapsulant chemistry and UV cutoff;
- glass/glass or glass/backsheet construction;
- edge seals and lamination process;
- junction box and bypass diode quality;
- frame strength and mounting configuration;
- production consistency of the exact BOM.
This distinction matters in 2026. Independent accelerated testing continues to show that modules using the same cell technology can have very different degradation behavior. A buyer should therefore evaluate technology + exact BOM + test evidence, not technology name alone.
Degradation Is Not the Same as Efficiency Loss
Module efficiency is the percentage of incoming solar energy converted into electricity under defined conditions. Degradation is the reduction in the module's power capability relative to its initial state.
A 23% efficient module and a 21% efficient module can both degrade at 0.5%/year. The higher-efficiency module starts with more output per square meter, while degradation describes how much of that initial power is retained over time.
Linear vs Initial Degradation: Separate Physical Behavior from Warranty Structure
The phrase linear vs initial degradation is often used loosely. For procurement, it is more accurate to separate two different concepts: the module's physical degradation behavior and the manufacturer's warranty structure.
1. Physical Degradation Behavior
A module may experience a relatively larger stabilization loss early in life and then a slower long-term decline. Mechanisms can include LID, LeTID, UVID, PID and material aging. Actual field degradation is not guaranteed to follow a perfectly straight line.
2. Linear Performance Warranty
A linear performance warranty specifies a minimum warranted power level for every year of the warranty. It can still include a first-year drop.
For example:
- Year 1: maximum 1% loss;
- Years 2-30: maximum 0.4 percentage-point loss per year;
- End of Year 30: minimum 87.4% of nameplate power.
That is still a linear performance warranty even though Year 1 has a separate allowance.
3. Tiered or Step Warranty
Older warranty structures often guaranteed one minimum power threshold for an early period and another threshold for later years, such as 90% through Year 10 and 80% through Year 25. Linear warranties replaced this approach because they define a yearly minimum rather than allowing large warranty "steps."
Linear vs Tiered Warranty Comparison
| Parameter | Linear Performance Warranty | Tiered / Step Warranty |
|---|---|---|
| First-year allowance | Usually stated separately | May be embedded in first tier |
| Guaranteed power each year | Yes | No, only threshold bands |
| Financial modeling | More precise | Less precise |
| Warranty claim threshold | Year-specific | Tier-specific |
| B2B preference | Preferred | Usually less attractive |
Procurement Takeaway
Do not write an RFQ that simply says "linear degradation required." Ask the supplier to state the exact annual warranty schedule:
- maximum first-year degradation;
- maximum annual degradation from Year 2 onward;
- warranted power at Year 10, 25 and 30 where applicable;
- whether annual decline is defined as percentage points of nameplate power or another calculation basis;
- performance measurement and warranty-claim procedure.
This prevents a common comparison error: two suppliers may both advertise a "30-year linear warranty" while offering different first-year allowances and different annual decline limits.
Related reading: N-Type Solar Panel Guide — compare N-type and P-type cell architectures before evaluating warranty curves.
Solar Panel Degradation Rates by Technology: PERC vs TOPCon vs HJT
PERC, TOPCon and HJT have different degradation mechanisms, but technology-level degradation ranges should be treated as procurement benchmarks rather than guaranteed field outcomes. TOPCon and HJT have not yet accumulated the same 20+ years of large-scale field history as mature P-type technologies, so long-term claims rely heavily on accelerated reliability testing, shorter-term field data and manufacturer warranty schedules.
Practical B2B Comparison
| Parameter | P-type PERC | N-type TOPCon | N-type HJT |
|---|---|---|---|
| Typical modern first-year warranty allowance | ~1-2% depending on product | ~1% common | ~1% common; some products lower |
| Typical annual warranty decline after Year 1 | ~0.5-0.7% | ~0.4% common | ~0.25-0.4% common |
| Common performance-warranty term | 25-30 years | 30 years increasingly common | 30 years increasingly common |
| BO-LID risk | Higher for boron-doped P-type; mitigated by gallium doping/light soaking | Not subject to classic boron-oxygen LID | Not subject to classic boron-oxygen LID |
| UVID risk | BOM-dependent | Important screening item | Important screening item |
| Best procurement use | Cost-sensitive projects with strong test evidence | Mainstream high-efficiency B2B projects | Premium/high-yield projects where cost and BOM qualification are justified |
Important: Do not compare technologies using only advertised annual degradation. Compare the exact warranty document and the exact BOM's reliability evidence.
P-type PERC
PERC modules have a long field history and remain relevant in cost-sensitive projects. Classic boron-doped P-type cells can suffer boron-oxygen light-induced degradation, but modern PERC products often use gallium-doped wafers and factory stabilization processes that significantly reduce this effect.
This is why older statements such as "PERC always loses 2-3% in the first year" are no longer reliable as a universal benchmark.
For PERC procurement, check:
- wafer doping and LID-mitigation method;
- first-year warranty allowance;
- LeTID test results;
- PID resistance;
- damp heat and backsheet/encapsulant durability;
- EL images and mechanical reliability.
N-type TOPCon
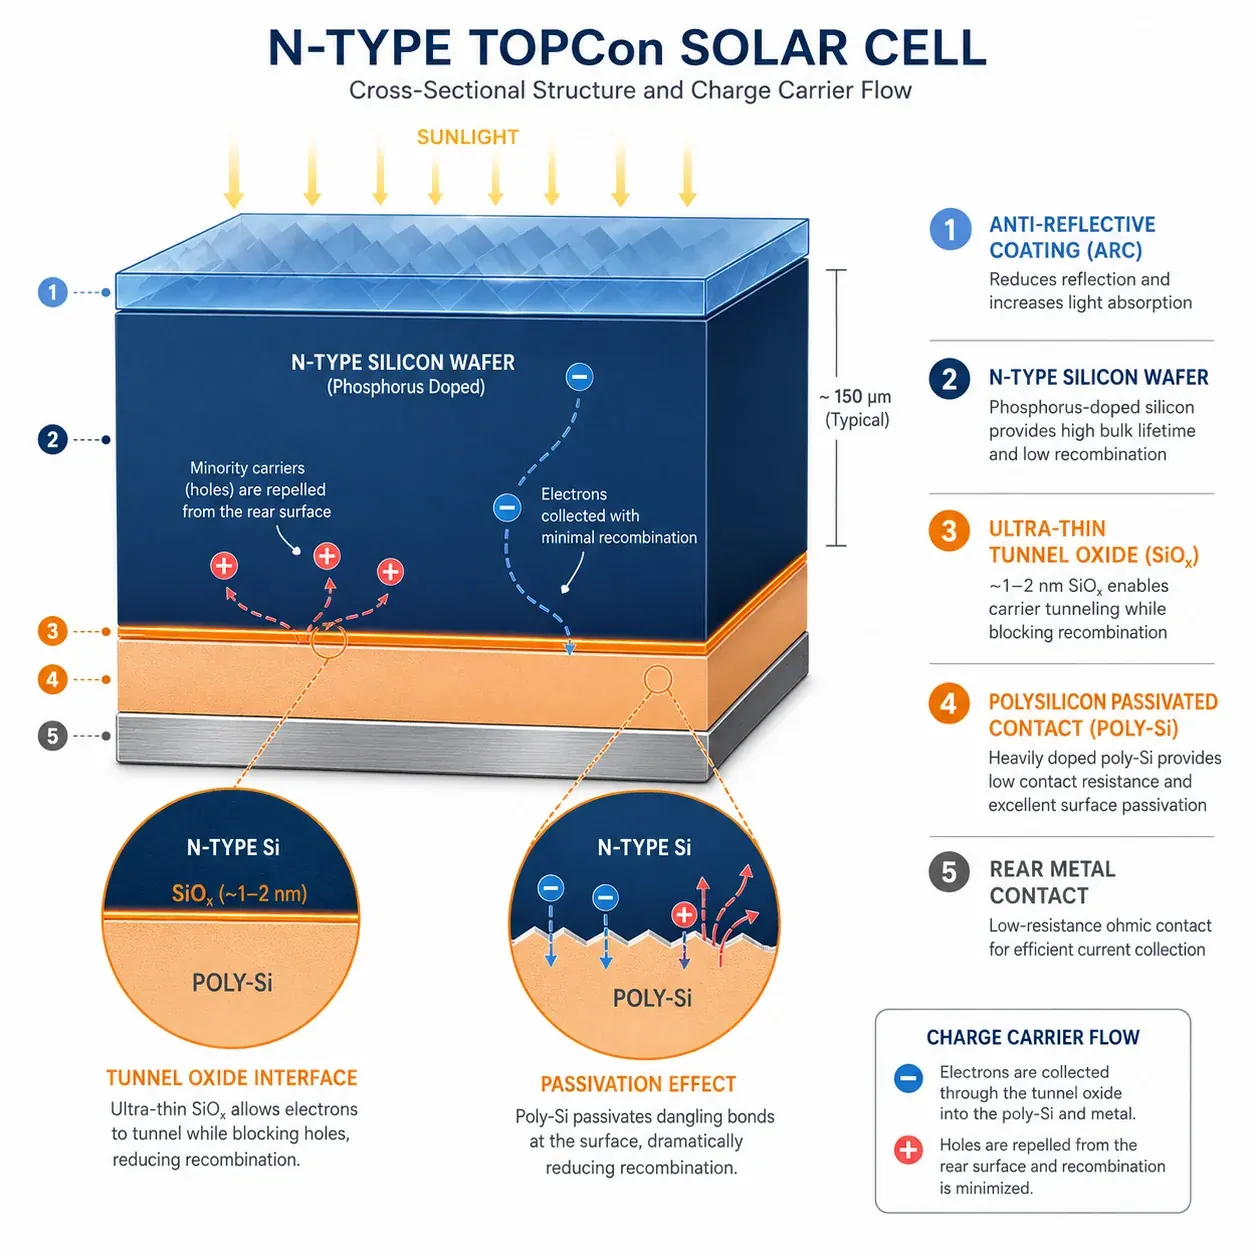
TOPCon eliminates the classic boron-oxygen LID mechanism associated with boron-doped P-type silicon and usually offers a stronger long-term warranty curve. A common modern warranty structure is around 1% first-year loss plus 0.4%/year thereafter, often to Year 30.
However, "N-type" does not mean "degradation-proof." Independent Kiwa PVEL testing has shown meaningful BOM-to-BOM variation in thermal cycling, damp heat, PID and especially UV-induced degradation.
For TOPCon, buyers should pay particular attention to:
- metallization and solder/interconnection reliability;
- encapsulant formulation and UV cutoff;
- glass thickness and module mechanical design;
- PID-polarization behavior;
- extended UV testing where available;
- supplier change-control rules for the certified BOM.
N-type HJT
HJT has attractive temperature performance and many manufacturers offer very low annual warranty-decline limits, commonly around 0.25-0.3%/year after Year 1 on selected products.
But HJT should not automatically be assigned the lowest "real-world degradation rate" in every project. Long-term field data at modern commercial scale are still developing, and independent accelerated tests show that some HJT BOMs can be sensitive to UV or damp-heat stress.
HJT is therefore best evaluated as a premium architecture with strong potential, subject to the same BOM-level qualification discipline as TOPCon.
What 2025-2026 Independent Testing Changes
Kiwa PVEL's recent scorecards add an important nuance to older technology comparisons:
- In 2025 LID+LeTID testing, median LID power loss was about 0.4% for TOPCon, 0.4% for PERC and 0.3% for HJT, showing that modern BOMs across all three technologies can control initial light-induced loss well.
- UVID testing showed much wider variation, including meaningful degradation in some TOPCon and HJT BOMs.
- The 2026 Scorecard lists only five BOMs as Top Performers across all reliability tests, while 87% of manufacturers experienced at least one Product Qualification Program failure. That reinforces why technology labels and model-family names are not enough for qualification.
For procurement, this means "N-type has lower warranty degradation" and "this exact N-type BOM is independently reliable" are two different claims. Require evidence for both.
Six Major Causes of Solar Panel Degradation
Solar panel degradation is driven by interacting electrical, optical, thermal and mechanical mechanisms. B2B buyers should translate these mechanisms into test-document requirements rather than relying on generic supplier claims.
1. LID and LeTID
Light-Induced Degradation (LID) is a power change that occurs after a module is exposed to light. Classic BO-LID is associated with boron-oxygen complexes in boron-doped P-type silicon.
Light and Elevated Temperature Induced Degradation (LeTID) occurs under combined illumination and elevated temperature and can affect module output over a longer stabilization period.
Modern cell processes have reduced both mechanisms substantially, so current test data are more useful than decade-old technology averages.
RFQ action: Require LID/LeTID test data for the proposed BOM and ask whether cells are stabilized before shipment.
2. UV-Induced Degradation (UVID)
UVID can affect cell passivation, anti-reflective coatings and encapsulation systems. It has become a more important procurement topic as module architectures, coatings and encapsulants change.
Independent testing has shown that some modern N-type BOMs can experience significant UV-related power loss, while other BOMs remain stable. Encapsulant additives and UV cutoff wavelength can materially affect the result.
RFQ action: For high-irradiance projects, request extended UV/UVID evidence in addition to baseline qualification certificates.
3. Potential-Induced Degradation (PID)
PID is caused by high-voltage stress between the active cell circuit and grounded module components. Its severity is affected by voltage polarity, temperature, humidity, cell passivation and module materials.
Modern utility projects often operate at high DC system voltages, making PID screening especially important.
RFQ action: Require current PID test documentation. IEC TS 62804-1 was updated in 2025 and now includes procedures addressing both PID-shunting and PID-polarization behavior for crystalline-silicon modules.
4. Thermal Cycling and Interconnection Fatigue
Modules repeatedly expand and contract as temperature changes between day and night. This can fatigue solder joints, ribbons, metallization and junction-box connections.
Possible consequences include:
- increasing series resistance;
- broken interconnections;
- bypass diode failures;
- cell crack propagation;
- gradual power loss.
RFQ action: IEC 61215 provides baseline qualification testing. For bankable projects, consider extended-stress evidence such as TC600 under IEC TS 63209-1 or an equivalent independent reliability program.
5. Damp Heat, Moisture and Corrosion
High temperature and humidity accelerate corrosion, delamination, encapsulant degradation and insulation problems. Coastal and tropical sites deserve additional attention because moisture and temperature can interact with PID and material aging.
RFQ action: Require IEC 61215 damp-heat qualification and, for higher-risk projects, extended evidence such as DH2000 under IEC TS 63209-1 or independent PQP testing.
6. Mechanical Damage, Microcracks and Installation Quality
Cells can be damaged during manufacturing, transport, handling or installation. Wind, snow, hail and mounting stress can then propagate microcracks and create inactive areas or hotspots.
Common causes include:
- lifting modules by cables or junction boxes;
- walking or kneeling on modules;
- incorrect clamp zones;
- excessive or uneven clamp torque;
- weak frames or thin glass under high loads;
- poor packaging or container handling.
RFQ action: Require pre-shipment EL inspection, defined packaging standards, mechanical-load evidence and clear installation instructions. For large projects, consider sampling EL inspections after delivery and after installation.
Related reading: Solar Mounting System Guide — racking design and clamp placement influence mechanical reliability.
First-Year Solar Panel Degradation: What Buyers Should Expect
First-year degradation should be evaluated separately from long-term annual degradation, but current buyers should avoid using outdated technology stereotypes.
Recent independent testing shows that well-designed modern PERC, TOPCon and HJT BOMs can all have relatively low LID/LeTID losses. In Kiwa PVEL's 2025 eligible BOMs, median LID loss was approximately 0.4% for TOPCon, 0.4% for PERC and 0.3% for HJT.
That does not mean every module will lose exactly those amounts in Year 1. Accelerated test results and field degradation are different metrics. The procurement lesson is that the exact module design matters more than a generic statement such as "PERC = 3% first-year loss" or "N-type = zero degradation."
First-Year Procurement Checklist
| Item | Buyer Requirement |
|---|---|
| Warranty allowance | State maximum Year-1 loss separately |
| Stabilization process | Ask supplier how cells/modules are stabilized before shipment |
| LID/LeTID evidence | Require test results for exact model/BOM |
| UVID evidence | Strongly preferred for N-type modules in high-UV regions |
| Initial flash data | Store factory or third-party Pmax data as project baseline |
| EL inspection | Require outgoing EL and retain traceable images |
Why Year-1 Modeling Matters
If a 1 MWp plant has a first-year specific yield of 1,400 kWh/kWp, each additional 1 percentage point of Year-1 loss corresponds to roughly 14,000 kWh of energy in that year before other losses and operational effects are considered.
For projects with PPAs, self-consumption savings or merchant revenue, first-year loss directly affects cash flow. Model it explicitly rather than hiding it inside a single lifetime-average degradation assumption.
How to Calculate Solar Panel Degradation Over 25 Years
There are two useful calculations, and they should not be confused.
A. Linear Warranty Floor
Many manufacturers express the warranty as a fixed percentage-point decline from nameplate power.
If:
- first-year loss =
d1; - annual warranty decline after Year 1 =
d; - year number =
N;
then a simple warranty-floor model is:
Year-N warranted power = P0 × [1 – d1 – (N – 1) × d]
Example: first-year loss 1%, then 0.4 percentage points per year.
- Year 1: 99.0%
- Year 25: 89.4%
- Year 30: 87.4%
This is why 87.4% should not automatically be labeled a Year-25 figure. In many current N-type warranties, it is the Year-30 minimum.
B. Engineering Degradation Model
For energy-yield modeling, analysts may instead apply a proportional annual degradation factor:
Year-N output = Year-1 output × (1 – d)^(N – 1)
This is a compounding model and is not identical to a manufacturer warranty schedule.
For procurement and finance models, clearly label which method you are using.
How Degradation Rate Affects 25-Year Energy Yield, ROI and TCO
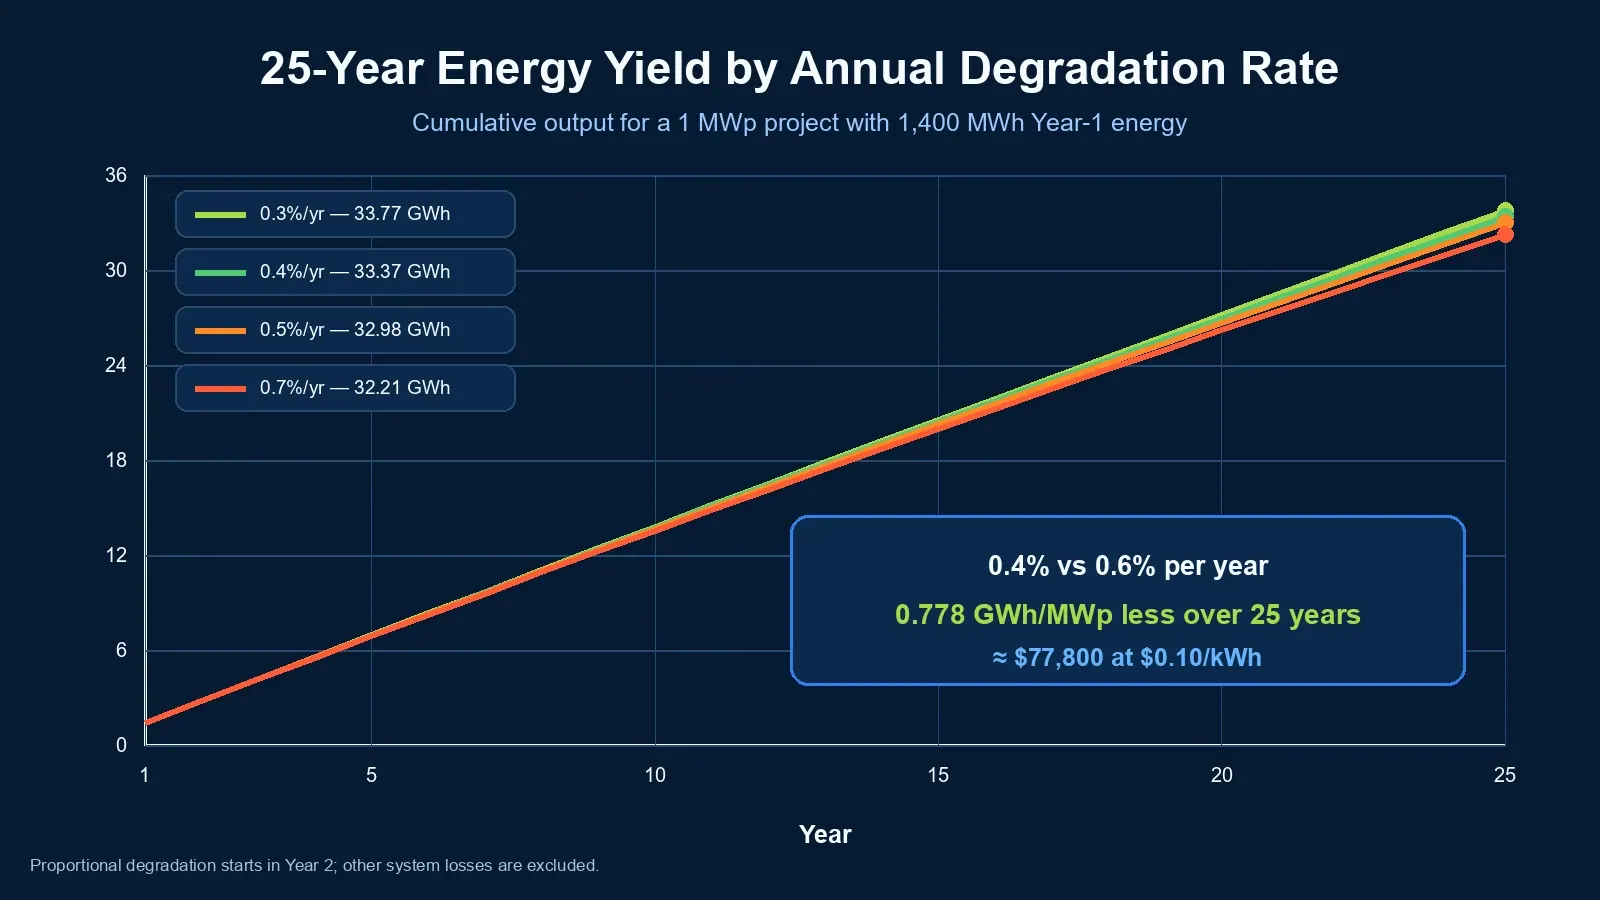
Small annual degradation differences can create large lifetime energy differences at MW scale, but the impact should be calculated rather than estimated with a generic revenue claim.
Example: 100 kWp System, 25 Years
Assumptions:
- DC capacity: 100 kWp;
- Year-1 specific yield before degradation: 1,400 kWh/kWp;
- Year-1 energy: 140,000 kWh;
- no capacity expansion or repowering;
- proportional annual degradation applied from Year 2;
- electricity value: $0.10/kWh for the revenue comparison only.
| Annual Degradation | Year-25 Energy | 25-Year Cumulative Energy | Revenue vs 0.4%/yr |
|---|---|---|---|
| 0.3%/yr | ~130,260 kWh | ~3,376.9 MWh | +~$3,980 |
| 0.4%/yr | ~127,160 kWh | ~3,337.0 MWh | Baseline |
| 0.5%/yr | ~124,130 kWh | ~3,297.8 MWh | -~$3,920 |
| 0.7%/yr | ~118,280 kWh | ~3,221.2 MWh | -~$11,590 |
At 1 MW, multiply the energy and revenue differences by 10. At 10 MW, multiply them by 100.
What Does a 0.2%/Year Difference Mean?
Using the same assumptions, comparing 0.4%/year vs 0.6%/year produces approximately 778 MWh less cumulative energy per MW over 25 years, or about $77,800 per MW at $0.10/kWh.
The exact financial impact changes with:
- local irradiation and temperature;
- clipping and DC/AC ratio;
- bifacial gain;
- curtailment;
- system availability;
- soiling and cleaning strategy;
- degradation model;
- PPA tariff or avoided retail electricity price;
- O&M cost and financing structure.
Therefore, avoid universal claims such as "every 0.1% increase in degradation reduces IRR by X%." IRR and LCOE are project-specific outputs, not fixed technology constants.
B2B Procurement Rule
Compare module price premiums against modeled lifetime energy value, not only nameplate wattage or Year-1 efficiency. A slightly more expensive module may be economically superior if its warranty, reliability evidence and energy-yield profile are materially better.
Related reading: Hybrid Solar System Guide — long-term module output should be included in system sizing and lifecycle planning.
How to Specify Solar Panel Degradation in an RFQ
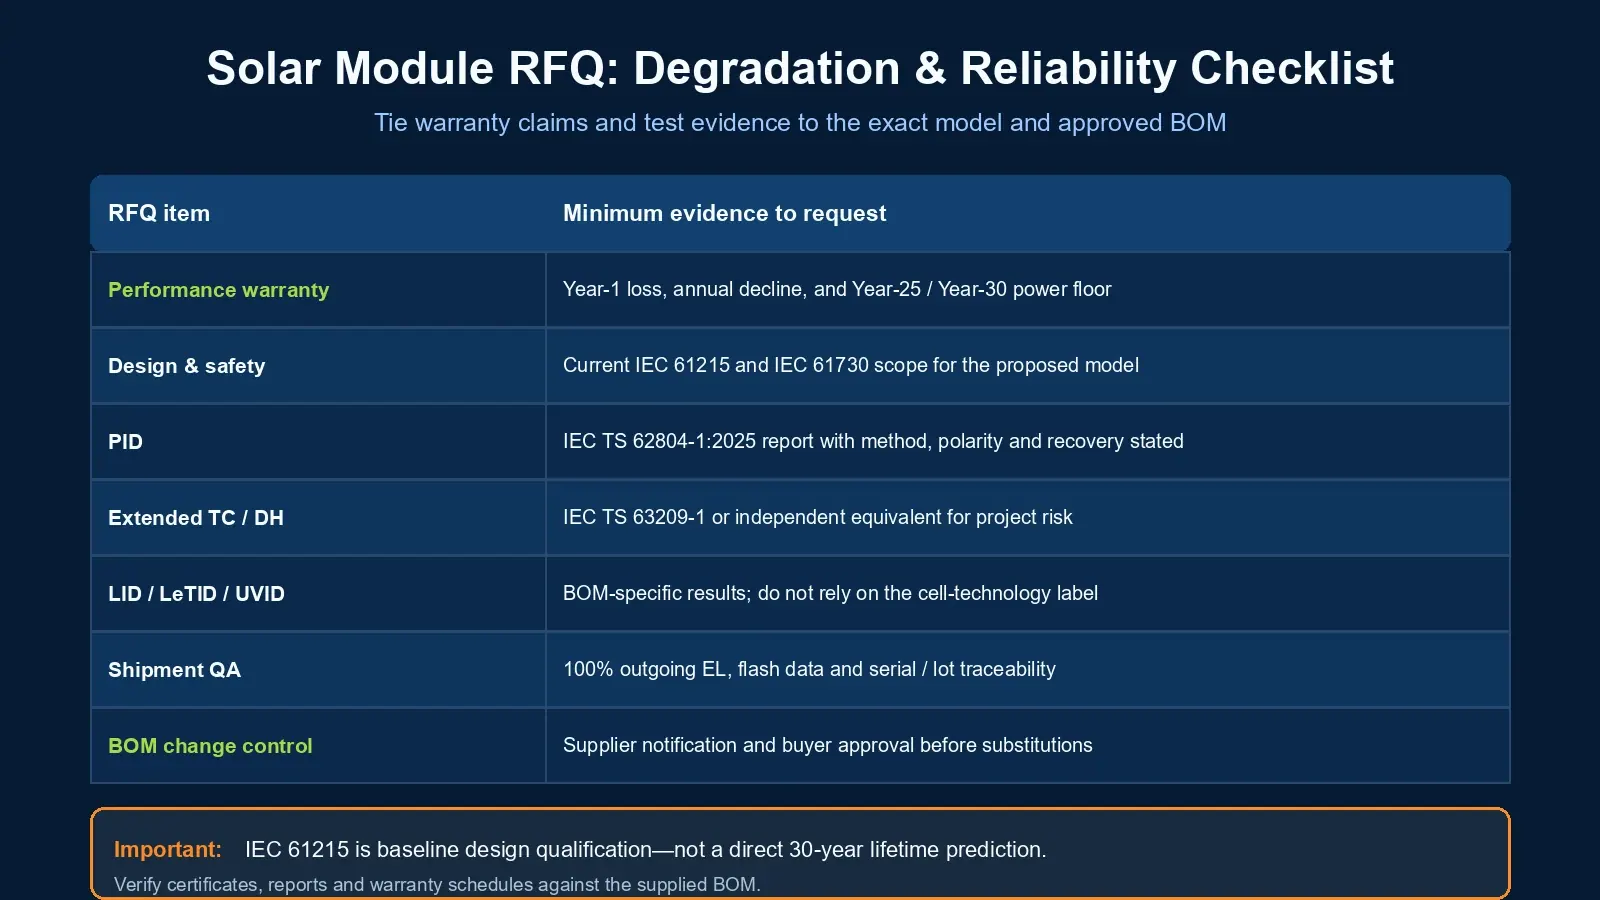
A strong RFQ should convert degradation claims into measurable contractual requirements. Do not use only one line such as "annual degradation ≤0.5%." Specify the complete warranty curve, test evidence and acceptance process.
RFQ Degradation Specification Template
| RFQ Parameter | Recommended Requirement | Verification |
|---|---|---|
| Performance warranty model | Linear annual minimum-power schedule | Manufacturer warranty document |
| First-year degradation | State maximum allowed value separately | Warranty schedule + stabilization/LID evidence |
| Annual decline after Year 1 | State maximum percentage points/year | Warranty schedule |
| Year-25 / Year-30 power | State both where relevant | Warranty schedule; do not mix Year 25 and Year 30 |
| IEC design qualification | Current IEC 61215 series | Full certificate/report scope for exact model |
| Safety qualification | Current IEC 61730 series | Certificate/report scope |
| Extended thermal cycling | TC600 preferred for higher-risk/bankable projects | IEC TS 63209-1 or independent equivalent |
| Extended damp heat | DH2000 preferred for tropical/coastal risk screening | IEC TS 63209-1 or independent equivalent |
| PID | Current IEC TS 62804-1 evidence | Test report with polarity/method stated |
| LID + LeTID | BOM-specific test evidence | Independent or accredited-lab report |
| UVID | Extended UV/UVID evidence where available | Independent test, especially for N-type BOMs |
| EL inspection | 100% outgoing EL + traceability | Images linked to serial number/lot |
| Flash test | STC Pmax data with measurement uncertainty | Factory and/or third-party sampling |
| BOM change control | Supplier notification/approval before material changes | Contract clause + approved BOM list |
Important Standards Distinction
IEC 61215 is baseline design qualification, not a 25- or 30-year lifetime simulation. For extended reliability screening, IEC TS 63209-1:2021 was created specifically to supplement IEC 61215 with longer stress sequences for comparative reliability assessment.
That distinction fixes a common RFQ error: TC600 and DH2000 should not simply be described as the basic IEC 61215 test requirement. They are extended-stress levels used in IEC TS 63209-1 and independent programs such as Kiwa PVEL PQP.
Similarly, PID requirements should reference the current IEC TS 62804-1:2025 where applicable, because the 2025 edition adds methods for PID-shunting and PID-polarization in crystalline-silicon modules. The specification is not intended as the normative test method for heterojunction modules, although it may provide guidance; HJT projects should confirm the applicable method with the test laboratory.
Documents to Require from Suppliers
- current IEC 61215 certificate and report scope;
- current IEC 61730 safety certificate;
- IEC TS 62804-1 PID report where applicable;
- extended TC/DH data for the exact BOM;
- LID + LeTID results;
- UVID/extended UV results where available;
- EL images and flash-test records;
- BOM declaration and change-control procedure;
- performance warranty document;
- warranty-claim measurement procedure;
- third-party factory audit or reliability report for large projects.
Do Not Evaluate Only the Model Name
Two modules with the same marketing model family can use different glass, encapsulant, cells, ribbons, frames or junction boxes across production sites or revisions. If a project depends on specific reliability-test results, the purchase contract should tie supply to the tested and approved BOM or define an acceptable change-control process.
Related reading: Solar Project BOM Checklist — use degradation and reliability requirements as part of complete EPC procurement control.
Solar Panel Degradation Procurement Checklist
Before approving a module supplier, confirm all of the following:
- First-year degradation is stated separately.
- Annual degradation after Year 1 is clearly defined.
- Year-25 and Year-30 guaranteed power are not confused.
- Linear warranty is supported by a yearly minimum-power schedule.
- Warranty figures are not presented as proven field averages.
- IEC 61215 and IEC 61730 certificates apply to the proposed model.
- PID evidence is current and relevant to the cell/module architecture.
- Extended TC/DH testing is available for high-risk or bankable projects.
- LID/LeTID and UVID risks have been reviewed.
- EL and flash-test data are traceable to production lots.
- BOM change control is included in the supply agreement.
- Financial models use the same degradation assumptions as the procurement specification.
FAQ: Solar Panel Degradation
What is the average solar panel degradation rate per year?
A widely cited historical field median is about 0.5%/year, but modern module procurement should use the exact product warranty, BOM-level reliability evidence and project climate rather than a single industry average.
How much do solar panels degrade in the first year?
It depends on cell technology, stabilization process and BOM. Modern module warranties commonly allow about 1-2% in Year 1, while recent independent LID testing has shown median losses below 0.5% for many tested PERC, TOPCon and HJT BOMs. Warranty allowance and measured test loss are not the same thing.
Is 87.4% a Year-25 solar panel warranty value?
Not necessarily. In many current N-type TOPCon warranties, 87.4% is the minimum at Year 30, based on roughly 1% first-year loss followed by 0.4 percentage points per year. Always check the exact warranty schedule.
What is a linear solar panel performance warranty?
A linear performance warranty specifies a minimum guaranteed output for every year of the warranty. It can still include a separate first-year degradation allowance. It is different from an older tiered warranty that guarantees only broad thresholds over multi-year periods.
Which has the lowest degradation: PERC, TOPCon or HJT?
HJT products often advertise the lowest annual warranty-decline limits, while TOPCon commonly offers stronger warranty curves than conventional PERC. However, technology alone does not determine field reliability. UVID, thermal cycling, damp heat, PID and mechanical results can vary significantly by BOM.
Does N-type eliminate LID and LeTID?
N-type silicon avoids the classic boron-oxygen LID mechanism of boron-doped P-type silicon, but it should not be described as immune to every light-, temperature- or UV-related degradation mechanism. Modern independent testing still evaluates LID, LeTID and UVID for N-type modules.
How do I calculate solar panel degradation over 25 years?
For a linear warranty floor, apply the first-year loss and then subtract the stated annual percentage-point decline. For an engineering energy model, analysts often apply a proportional annual factor such as Year-N = Year-1 × (1-d)^(N-1). State which method is used because the two are not identical.
What degradation requirements should I put in a solar panel RFQ?
Specify first-year loss, annual decline after Year 1, Year-25/30 guaranteed power, warranty measurement procedure, IEC 61215/61730, current PID testing, extended TC/DH evidence where appropriate, LID/LeTID/UVID results, EL inspection, flash testing and BOM change control.
Are IEC 61215 tests enough to prove a 30-year module life?
No. IEC 61215 is a design qualification standard with pass/fail criteria; it is not a direct 30-year lifetime prediction. Extended-stress programs such as IEC TS 63209-1 and independent qualification programs provide additional comparative reliability evidence.
About GINZA Solar
GINZA Solar supplies solar modules for distributors, EPC contractors and project buyers. For N-type TOPCon procurement, buyers should use the current product datasheet and performance-warranty document for the exact model as the contractual reference for wattage, first-year degradation, annual degradation and end-of-warranty power.
Request a Project Quote — Send your required wattage, project size, destination market, warranty curve and reliability-test requirements for a project-specific quotation.
View Solar Panel Products — Compare current module specifications and request matching test documents for the proposed BOM.
Sources and Methodology
This guide separates three evidence types that are often mixed together in solar-panel marketing:
- Long-term field evidence — useful for historical degradation benchmarks.
- Manufacturer performance warranties — contractual minimum power, not measured field averages.
- Accelerated reliability testing — useful for comparing BOM susceptibility to specific failure mechanisms, but not a direct year-for-year field-life prediction.
Key references used for technical validation include:
- NREL / Jordan & Kurtz, Photovoltaic Degradation Rates — An Analytical Review (historical field degradation benchmark).
- Kiwa PVEL, PV Module Reliability Scorecard (LID+LeTID, UVID, TC, DH, PID and BOM-level reliability trends).
- IEC 61215-2:2021, Terrestrial photovoltaic modules — Design qualification and type approval.
- IEC TS 63209-1:2021, Photovoltaic modules — Extended-stress testing — Part 1: Modules.
- IEC TS 62804-1:2025, Photovoltaic modules — Test methods for detection of potential-induced degradation — Part 1: Crystalline silicon.