
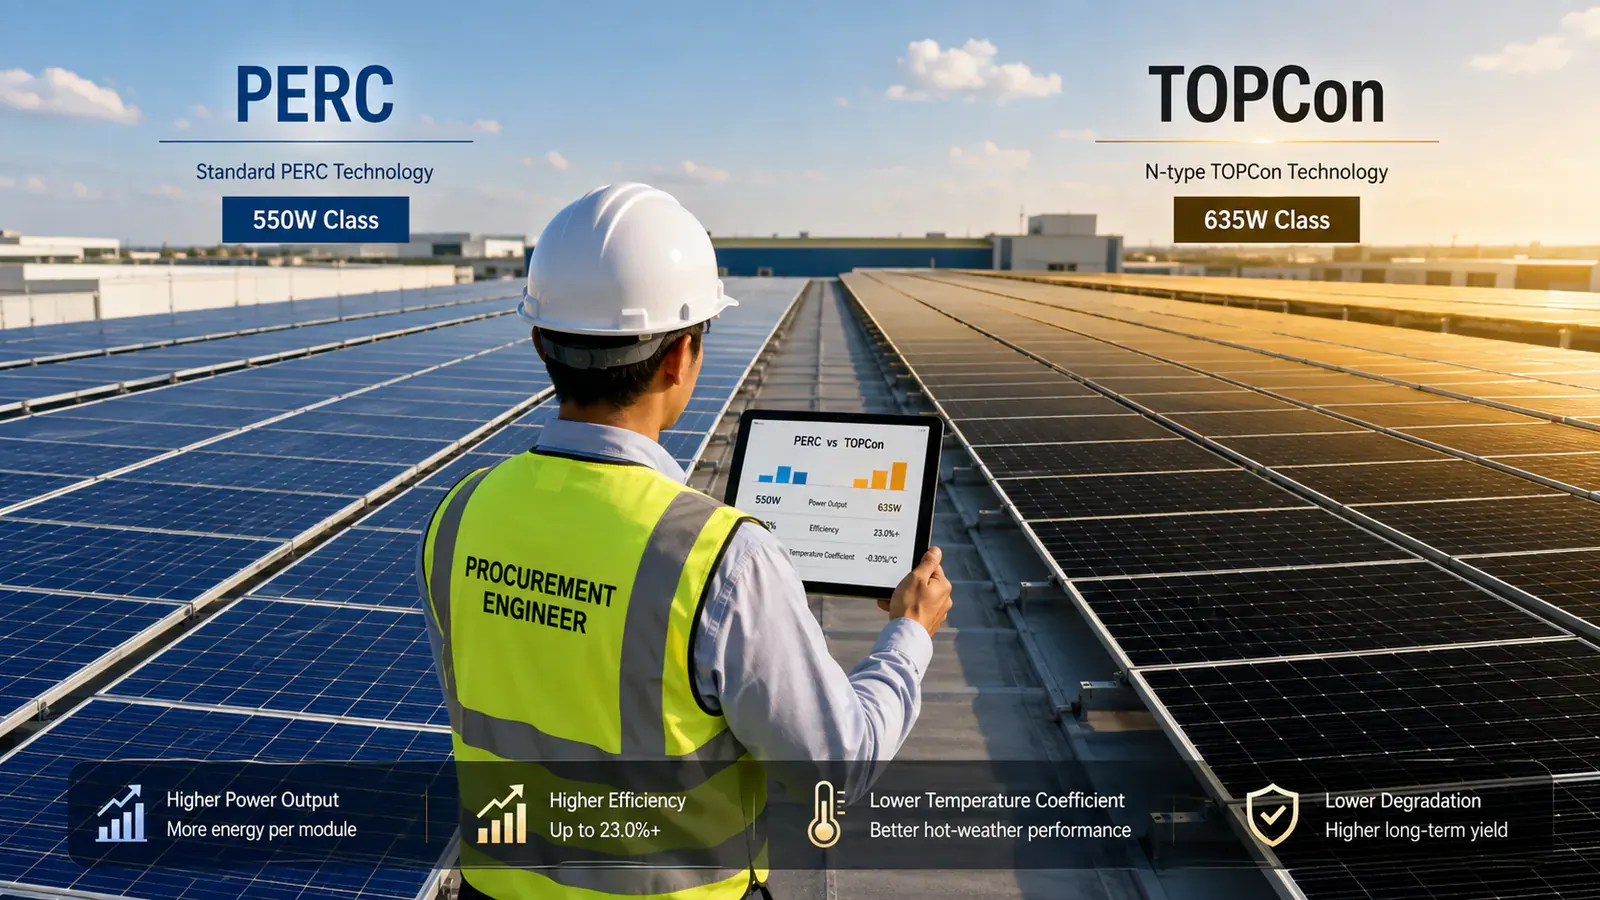
For most new B2B solar projects in 2026, TOPCon is the stronger default than PERC because it generally provides higher power density, a less-negative temperature coefficient, higher bifaciality, and lower warranted degradation. PERC can still be the better commercial choice when verified legacy inventory is substantially cheaper, usable area is not constrained, or the project has a short holding period.
TOPCon vs PERC at a Glance
- Best default for new C&I and utility projects: TOPCon
- Best reason to choose PERC: A material delivered-cost discount on verified inventory
- Typical module efficiency: About 22-24%+ for current TOPCon versus roughly 20-22% for PERC
- Typical Pmax temperature coefficient: About -0.29 to -0.35%/°C for TOPCon versus -0.35 to -0.40%/°C for PERC
- Typical bifaciality: About 80-85% for TOPCon versus 70-75% for bifacial PERC
- Procurement rule: Compare the exact module, BOM, factory, warranty, certificates, electrical limits, delivered price, and modeled site yield—not the cell-technology label alone
This guide gives EPC contractors, project buyers, and distributors a defensible comparison framework for technical review, TCO modeling, and RFQ preparation.
What Are TOPCon and PERC Solar Panel Technologies?
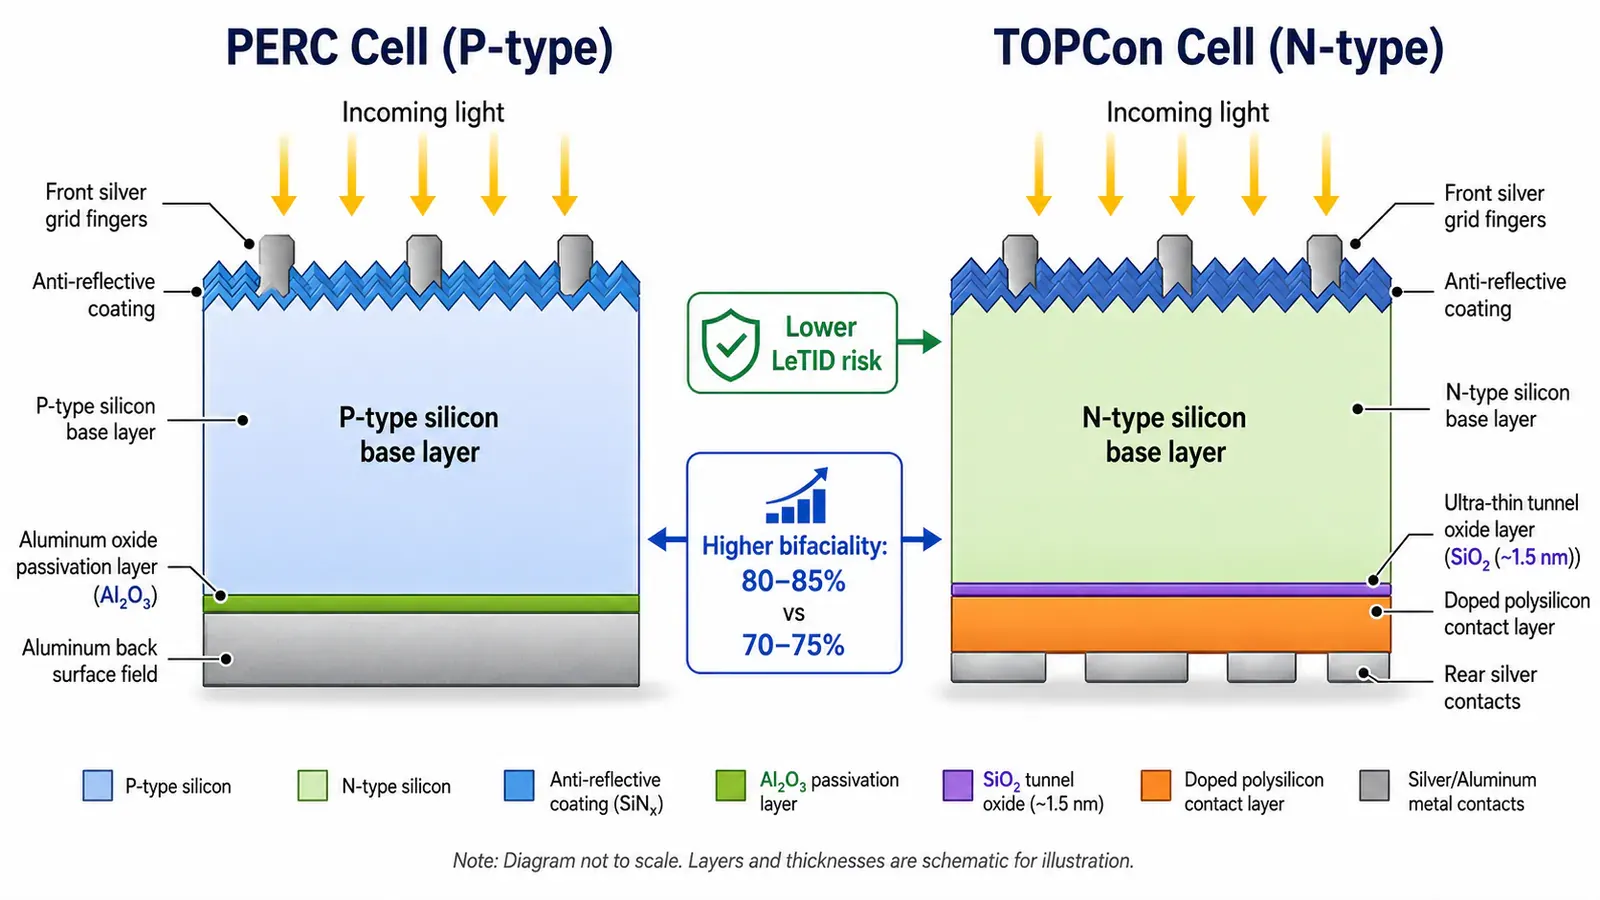
PERC and TOPCon are mainstream crystalline-silicon solar cell technologies. PERC typically uses P-type silicon with rear passivation, while today's mainstream TOPCon modules use N-type silicon with a tunnel-oxide passivated contact. Commercial module efficiencies commonly fall around 20-22% for PERC and 22-24%+ for TOPCon. The market transition is already well advanced: InfoLink reported that n-type TOPCon represented nearly 70% of module shipments among the global top-ten suppliers in 2024.
Both technologies convert sunlight into electricity through the photovoltaic effect, but they differ fundamentally in cell structure, silicon type, and manufacturing approach. Understanding these differences is essential for B2B buyers who need to specify panel technology in their procurement documents.
PERC (Passivated Emitter and Rear Cell)
PERC technology adds a dielectric passivation layer — typically aluminum oxide (Al₂O₃) — to the rear surface of a standard P-type monocrystalline silicon cell. This layer reduces electron recombination at the back surface and improves absorption of long-wavelength light, boosting cell efficiency from the ~20% of standard Al-BSF cells to 22-23.5%.
PERC dominated the solar market from 2015 to 2022 due to its mature manufacturing process, well-established supply chain, and relatively low production cost. However, PERC is approaching its theoretical efficiency ceiling of approximately 24.5%, and new PERC production line investments have declined sharply since 2023. Typical PERC modules deliver 540-550W in a 72-cell format.
Key B2B characteristics of PERC:
- Strengths: Lower upfront cost, mature and reliable manufacturing, global supply availability
- Weaknesses: Efficiency ceiling (~24%), higher degradation rates, lower bifaciality, LeTID risk on P-type silicon
- Best for: Budget-constrained projects, short-term installations (<10 years), markets with limited TOPCon supply
TOPCon (Tunnel Oxide Passivated Contact)
TOPCon technology uses N-type monocrystalline silicon as the base material, combined with an ultra-thin tunnel oxide layer (~1.5nm) and a doped polysilicon contact layer on the rear surface. This structure achieves superior passivation compared to PERC, reducing carrier recombination and enabling cell efficiencies of 25-26.5%.
TOPCon overtook PERC across major shipment rankings during 2024. InfoLink's 2024 ranking of the top ten module manufacturers reported roughly 22% PERC and nearly 70% n-type TOPCon shipment share. TOPCon also benefits from partial compatibility with established PERC manufacturing infrastructure, which accelerated the industry transition. High-power commercial TOPCon modules commonly occupy the 580-635W class, including the GINZA Solar N-type range described in this guide.
Key B2B characteristics of TOPCon:
- Strengths: Higher efficiency, better temperature coefficient, lower warranted degradation, superior bifaciality, and substantially lower P-type LID/LeTID susceptibility
- Weaknesses: Higher silver paste consumption, slightly more complex manufacturing, marginally higher upfront cost
- Best for: Most B2B projects, hot climates, bankability-focused projects, long-term holdings
Technology Evolution Path
The mainstream c-Si technology transition is better described as Al-BSF → PERC → high-efficiency passivated-contact technologies. TOPCon has become the volume mainstream, while HJT remains a parallel high-efficiency route. IBC/back-contact is an architecture rather than a simple next step and can be combined with different cell concepts. TOPCon scaled fastest because manufacturers could reuse or adapt parts of the PERC production ecosystem while improving efficiency.
For a deeper understanding of N-type silicon advantages, see our N-Type Solar Panel Guide.
| Parameter | PERC | TOPCon |
|---|---|---|
| Full Name | Passivated Emitter and Rear Cell | Tunnel Oxide Passivated Contact |
| Cell Structure | P-type silicon + rear Al₂O₃ passivation | N-type silicon + tunnel oxide + poly-Si layer |
| Max Cell Efficiency | 23.5-24.5% | 25.5-26.5% |
| Typical Module Efficiency | 20-22% | 22-24.5% |
| Temperature Coefficient (Pmax) | -0.35 to -0.40%/°C | -0.29 to -0.35%/°C |
| Bifaciality Factor | 70-75% | 80-85% |
| Year 1 Degradation | 2-3% | 1-2% |
| Annual Degradation (Year 2+) | ~0.5-0.6% typical warranty range | ~0.3-0.5% typical warranty range |
| 25-Year Retained Power | ~82-85% of initial | ~87-90% of initial |
| Manufacturing Complexity | Lower (mature process) | Higher (additional steps) |
| Top-10 Module Shipment Mix (2024) | ~22% PERC | ~70% n-type TOPCon |
| B2B Recommendation | ⚠️ Budget projects only | ✅ Most B2B projects |
TOPCon vs PERC: Which Is Better for B2B Solar Projects?
For most new B2B solar projects in 2026, TOPCon is the stronger default specification than PERC. The main advantages are higher watts per square meter, a better temperature coefficient, higher bifaciality, and lower warranted degradation. However, buyers should not assume a universal “8-12% more energy per watt” benefit: for equal-nameplate systems, the yield difference depends on climate, rear-side irradiance, module design, and degradation assumptions.
For B2B buyers, the decision should be made on project economics rather than technology labels alone. TOPCon usually wins when roof or land area is constrained, operating temperatures are high, bifacial gain is available, or the asset will be held for decades. PERC can still be rational when discounted inventory materially lowers capex or a short project horizon reduces the value of TOPCon's long-term advantages.
Why B2B Projects Should Prioritize TOPCon
The case for TOPCon in B2B applications rests on five measurable advantages:
-
Higher efficiency and power density: 22-24%+ vs roughly 20-22% module efficiency means more nameplate watts can fit into the same active module area. As an illustration, 23% vs 21% efficiency is about 9.5% more DC nameplate capacity per equal active area before roof setbacks, module dimensions, and layout constraints are applied.
-
Better temperature performance: Using representative Pmax coefficients of -0.29%/°C for TOPCon and -0.38%/°C for PERC, a module operating at 55°C would show about a 2.7-percentage-point output advantage for TOPCon at that operating point. The annual energy impact is site-specific and should be modeled in PVsyst or equivalent software rather than assumed as a fixed percentage.
-
Lower warranted degradation: Many N-type TOPCon warranties specify lower first-year and annual degradation than legacy PERC products. A typical comparison is roughly 0.3-0.5%/year after year one for TOPCon versus about 0.5-0.6%/year for PERC, but the exact guarantee must be taken from the model-specific warranty document.
-
Superior bifaciality: TOPCon bifaciality commonly reaches about 80-85% versus roughly 70-75% for bifacial PERC. That can improve rear-side contribution on reflective ground, carports, trackers, and elevated arrays, but the actual kWh gain depends on albedo, row height, spacing, tracker geometry, and shading.
-
Stronger fit with current procurement pipelines: TOPCon is now the mainstream shipment technology, so buyers typically have broader access to current high-power products. Financing teams still evaluate the specific manufacturer, model, BOM, warranty, factory quality, and lender-approved-vendor requirements; TOPCon technology by itself does not guarantee bankability.
When PERC Still Makes Sense
PERC remains a viable option in specific scenarios:
- Extreme budget constraints where every $0.01/W matters for project viability
- Short-term installations with project horizons under 5 years
- Markets with limited TOPCon supply — some developing regions still have better PERC availability
- Existing PERC inventory that needs to be utilized in ongoing projects
B2B Project Decision Matrix
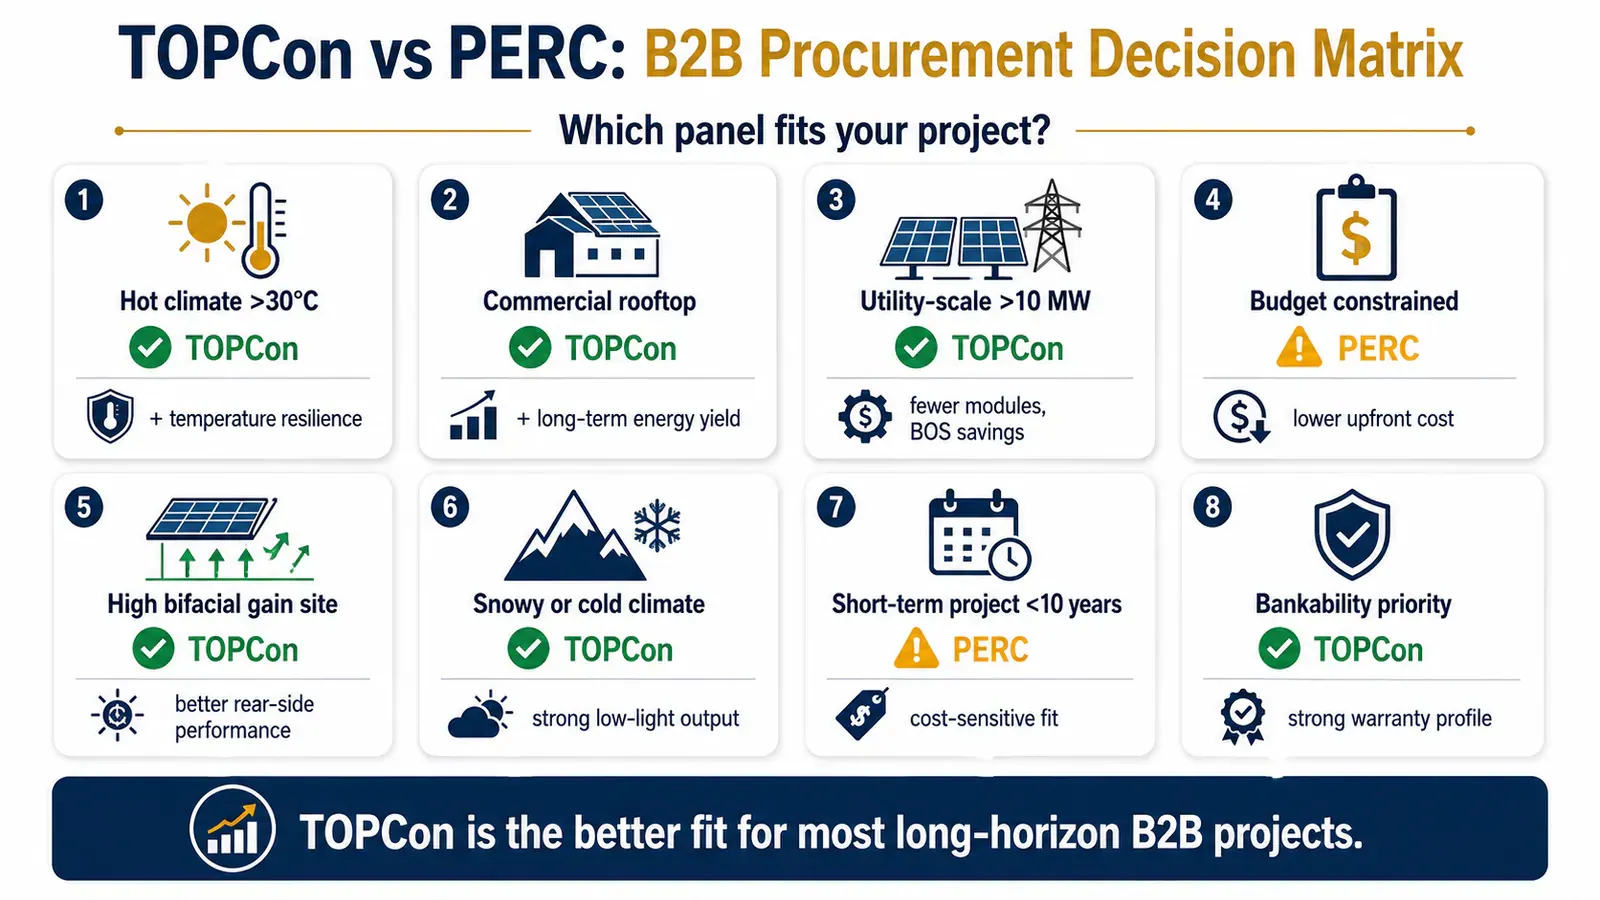
| Project Scenario | Recommended Choice | Key Reason | Procurement Metric to Model |
|---|---|---|---|
| Space-constrained commercial rooftop | ✅ TOPCon | Higher W/m² | DC capacity per usable roof area |
| Hot-climate rooftop or C&I site | ✅ TOPCon | Better Pmax temperature coefficient | Compare modeled hourly thermal losses |
| Utility-scale ground mount | ✅ TOPCon | High power class + bifaciality | Modules/MW, tracker count, cable/BOS cost, rear gain |
| Highly discounted legacy inventory | ⚠️ PERC | Lower acquisition cost may dominate | Delivered $/W + warranty + replacement risk |
| High-albedo bifacial site | ✅ TOPCon | Higher bifaciality factor | Site-specific rear irradiance and bifacial gain |
| Short-term asset (<5-7 years) | ⚠️ PERC can work | Long-term degradation advantage matters less | NPV over actual holding period |
| Long-term owner/operator | ✅ TOPCon | Lower warranted degradation | 20-30 year energy and cash-flow model |
| Lender-financed project | ✅ Usually TOPCon | Mainstream current supply, but vendor due diligence still required | Lender AVL, warranty, factory/BOM bankability |
GINZA Solar TOPCon Product Range
GINZA Solar's N-type TOPCon product line covers the full spectrum of B2B project requirements:
- GIZ635-78: 635W, 22.71% efficiency, 2465 × 1134 × 30mm
- GIZ620-78: 620W, 22.18% efficiency, 2465 × 1134 × 30mm
- 610W reference configuration: 2465 × 1134 × 30mm; final electrical data and model designation must be confirmed before quotation
- GIZ580-72: 580W, 22.45% efficiency, 2278 × 1134 × 30mm
These are the specifications currently published on GINZA's product pages. Temperature coefficients, bifaciality, degradation limits, certificate scope, and warranty terms must be confirmed from the latest model-specific datasheet and warranty document before issuing a PO.
TOPCon vs PERC Efficiency, Temperature, and Degradation: A Data Comparison
TOPCon modules commonly reach about 22-24%+ efficiency versus roughly 20-22% for PERC, while representative Pmax temperature coefficients are around -0.29 to -0.35%/°C for TOPCon and -0.35 to -0.40%/°C for PERC. TOPCon also tends to carry lower warranted degradation. These advantages matter, but their energy impact must be separated into two cases: same-area systems and same-nameplate-capacity systems.
These three performance dimensions — efficiency, temperature response, and degradation — are the technical foundation of TOPCon's economic advantage. Each metric individually offers a measurable improvement; combined, they create a compounding benefit that grows larger with every year of operation.
Efficiency Comparison
Module efficiency determines how much power you can install in a given area. The 2-2.5% absolute efficiency advantage of TOPCon over PERC may sound modest, but for B2B projects it has significant practical implications:
- Same usable area, more DC capacity: If module efficiency is 23% instead of 21%, the theoretical active-area power-density difference is about 9.5%. Real rooftop gain will be lower or higher depending on module dimensions, setbacks, access aisles, orientation, and layout.
- Fewer modules for the same nameplate capacity: A nominal 100kW array needs about 182 × 550W PERC modules or 159 × 630W TOPCon modules. This can reduce module handling and some BOS components, although larger-format module dimensions and structural design still need to be checked.
- Higher power class: GINZA Solar's 635W TOPCon module delivers 85W more per panel than a typical 550W PERC module.
Temperature Coefficient Impact
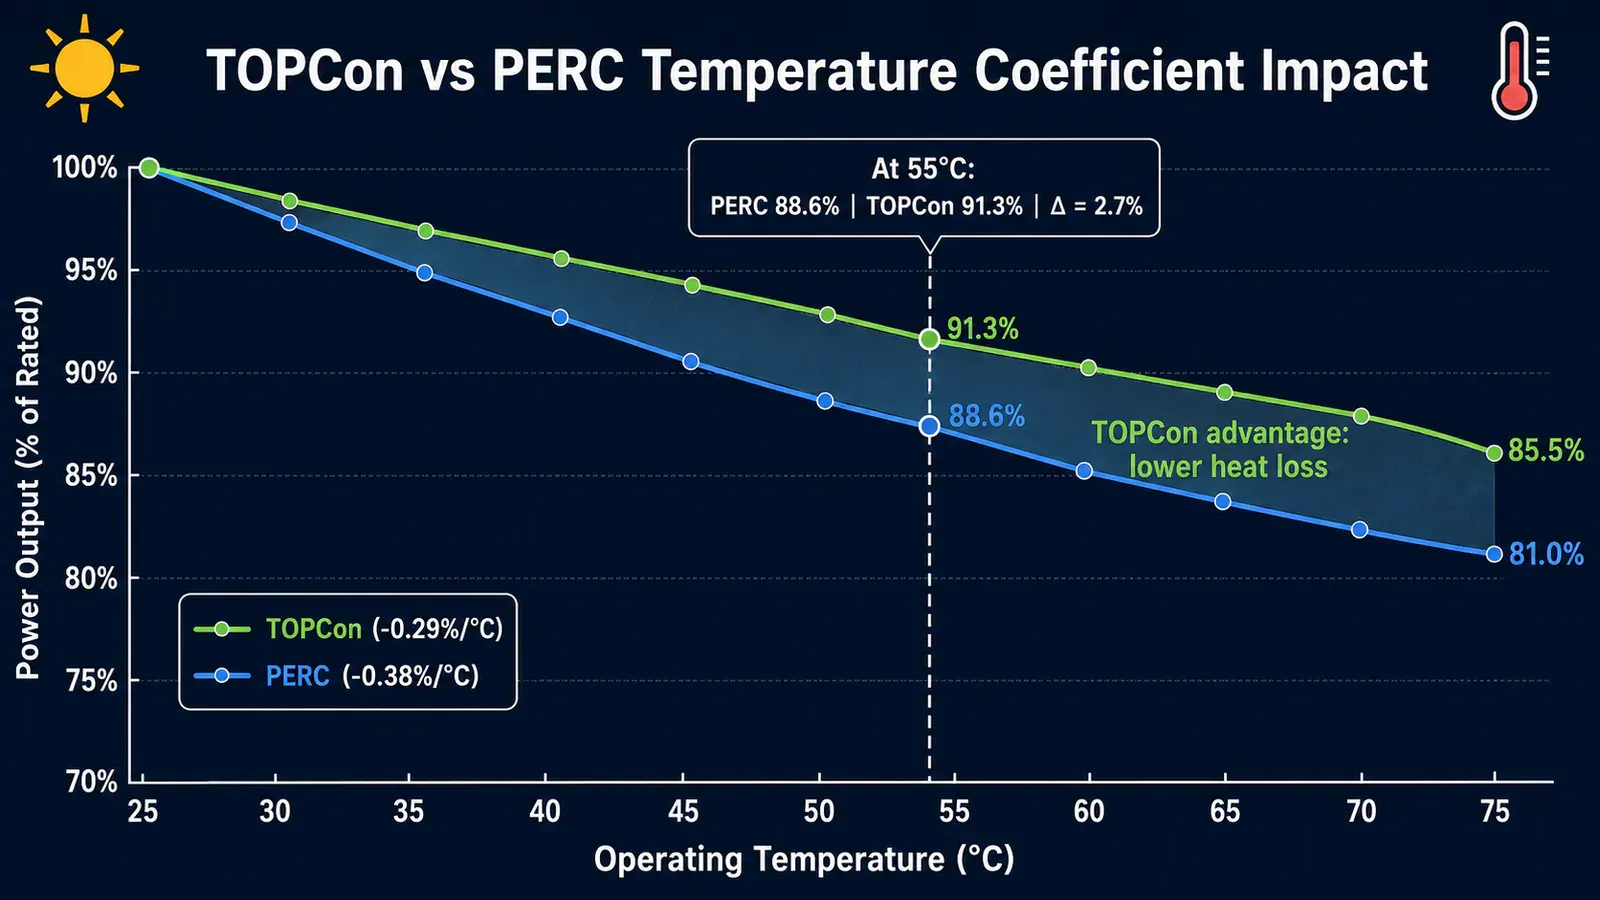
The temperature coefficient measures how much a panel's power output decreases for every 1°C increase in operating temperature above 25°C. This is one of the most underappreciated differences between TOPCon and PERC, and it has the largest impact in hot climates.
In hot climates, TOPCon's less-negative temperature coefficient reduces instantaneous thermal losses. It is not correct to convert the coefficient difference directly into a universal annual-yield percentage; the annual impact depends on the site's temperature distribution, wind, mounting configuration, irradiance profile, and module thermal behavior.
Consider a real-world example at 55°C operating temperature (30°C above STC):
- PERC: 30°C × 0.38%/°C = 11.4% power loss → panel produces 88.6% of rated power
- TOPCon: 30°C × 0.29%/°C = 8.7% power loss → panel produces 91.3% of rated power
- Difference: 2.7% more power from TOPCon at this single operating point
Over a full year, this advantage accumulates during hot high-irradiance hours. For investment-grade modeling, use hourly weather data and the actual module coefficients rather than applying a fixed “5-8%” uplift.
Degradation Rate Comparison
Degradation determines how much output is retained over the asset life. N-type TOPCon products commonly carry stronger linear power warranties than legacy PERC modules, often around 87-90% retained power in the 25-30 year range versus roughly 82-85% for older PERC warranty structures. These are warranty benchmarks, not a guarantee that every fielded TOPCon module will degrade at the same rate.
| Degradation Parameter | PERC | TOPCon | TOPCon Advantage |
|---|---|---|---|
| Year 1 Degradation | 2-3% | 1-2% | 1% less initial loss |
| Annual Degradation (Year 2+) | ~0.5-0.6% typical warranty range | ~0.3-0.5% typical warranty range | 0.2%/year less |
| 25-Year Retained Power | 82-85% | 87-90% | +5% more rated power |
| LID (Light Induced Degradation) | 1-2% | <1% | Lower initial loss |
| LeTID Risk | Higher (P-type silicon) | Lower (N-type silicon) | Reduced long-term risk |
LeTID and reliability note: Light and Elevated Temperature Induced Degradation (LeTID) is strongly associated with some P-type PERC cell architectures. N-type TOPCon avoids the classic boron-oxygen LID pathway and is generally less exposed to P-type LeTID, but buyers should not interpret this as “zero degradation risk.” Fraunhofer ISE's 2025 testing found that some commercial TOPCon module types remained UV-sensitive after stabilization, while also warning that common unstabilized UV tests can overstate field-relevant degradation. This reinforces the need for model- and BOM-specific reliability evidence.
For more detail on N-type construction, bifacial design, and RFQ requirements, see our N-Type Solar Panel Guide.
Bifaciality Performance
TOPCon panels commonly have an 80-85% bifaciality factor versus roughly 70-75% for bifacial PERC. Higher bifaciality increases the conversion of available rear irradiance, but it does not by itself guarantee a fixed 3-5% project yield gain. The site geometry and albedo determine how much rear irradiance is actually available.
Bifaciality factor measures the ratio of rear-side efficiency to front-side efficiency. A panel with 85% bifaciality generates 85% as much power from rear irradiance as it does from the same intensity of front irradiance. For installations above reflective surfaces (white rooftops, light-colored ground cover, sandy terrain), the additional rear-side energy can be substantial.
25-Year Energy Production: A More Defensible Sensitivity Model
A 100kW TOPCon system and a 100kW PERC system have the same STC nameplate capacity. Higher module efficiency does not automatically create more kWh per installed kW; it mainly allows more kW to fit into a constrained area. For equal-nameplate systems, the lifecycle yield difference should be modeled from temperature behavior, bifacial gain, low-light response, availability, and degradation.
The table below uses a transparent illustrative model rather than presenting one universal result.
| Scenario | PERC 25-Year Energy | TOPCon 25-Year Energy | TOPCon Difference |
|---|---|---|---|
| A. Same Year-1 yield; degradation only (0.55%/yr PERC vs 0.40%/yr TOPCon after Year 1) | ~3.396 GWh | ~3.456 GWh | +1.8% |
| B. TOPCon has +2% Year-1 site yield from temperature/other module behavior, then same degradation assumptions | ~3.396 GWh | ~3.525 GWh | +3.8% |
| C. Same roof area, TOPCon allows more installed DC capacity | Project-specific | Potentially materially higher | Driven by W/m² and layout |
Illustrative assumptions: 100kW DC nameplate for Scenarios A/B, 1,450 kWh/kWp Year-1 PERC yield, 25-year horizon, PERC annual degradation 0.55% after Year 1, TOPCon 0.40%. Scenario B adds a 2% site-yield advantage as a sensitivity case, not as a universal TOPCon guarantee.
Actual energy production varies significantly by location. Adjust irradiance, operating temperature, wind, albedo, soiling, mismatch, availability, clipping, DC/AC ratio, and degradation using project-specific simulation software.
The key procurement lesson is therefore more precise than “TOPCon makes 8-12% more energy”: TOPCon can create value through higher roof power density and modest but compounding per-kW performance advantages. The size of that value must be modeled for the actual site.
TOPCon vs PERC Cost: Price Comparison and Total Cost of Ownership for B2B
In 2026, B2B buyers should not use a fixed historical rule such as “TOPCon always costs $0.01-0.03/W more than PERC.” The technology transition, oversupply, regional trade rules, inventory age, and Incoterms have made the price spread highly dynamic. The correct procurement approach is to compare delivered project cost and lifecycle value using live quotations.
InfoLink's July 15, 2026 market update reported actual TOPCon module deliveries in China around RMB 0.65-0.73/W for ground-mounted projects and RMB 0.70-0.76/W for distributed projects. Export, CIF, DDP, tariff-affected, and local-distributor prices can be materially different, so these figures are market context rather than a procurement quote.
Use a TCO Formula Instead of a Fixed Technology Premium
For an EPC or project owner, the most defensible comparison is:
25-year project value = delivered module cost + BOS + installation + financing + O&M + replacement risk − lifetime energy value
The module technology affects several of those terms at the same time.
| TCO Component | PERC | TOPCon | B2B Procurement Question |
|---|---|---|---|
| Delivered module $/W | Often influenced by legacy inventory | Current mainstream pricing | What is the same-day EXW/FOB/CIF/DDP quote? |
| Modules per 100kW | ~182 at 550W | ~159 at 630W | Does fewer-module handling reduce labor/BOS? |
| Roof power density | Lower | Higher | Can the project install more kW within the same usable area? |
| Thermal losses | Higher with more-negative Pmax coefficient | Lower with better coefficient | What does hourly simulation show? |
| Bifacial contribution | Lower bifaciality typical | Higher bifaciality typical | Is rear irradiance actually available? |
| Degradation warranty | Typically weaker on legacy PERC | Typically stronger on N-type TOPCon | What is guaranteed in the model-specific warranty? |
| Replacement / warranty risk | Supplier- and model-dependent | Supplier- and model-dependent | Is the manufacturer financially and operationally able to honor claims? |
Worked Procurement Method for a 100kW Project
Instead of copying a generic internet TCO table, build the comparison from the live RFQ:
- Normalize the Incoterm. Convert every quote to the same basis — ideally delivered-to-site or at least the same FOB/CIF destination.
- Normalize nameplate capacity. Compare the number of modules needed to reach the same DC capacity and account for module oversizing or string constraints.
- Price the BOS delta. Recalculate rails, clamps, cable, connectors, labor, lifting, tracker tables, and container utilization.
- Run the energy model twice. Use the exact PAN/module parameters for PERC and TOPCon, not generic technology assumptions.
- Apply the warranty degradation curve. Model the contractual power guarantee separately from a more conservative field-performance sensitivity case.
- Discount future cash flow. Use the owner's WACC/discount rate, electricity tariff or PPA, curtailment assumptions, and expected holding period.
Why TOPCon Often Wins TCO Even at Similar $/W
TOPCon does not need a huge energy-yield advantage to make economic sense. On space-constrained C&I roofs, the ability to install more DC power can dominate project economics. On equal-capacity ground-mount projects, modest improvements in temperature losses, bifacial response, and degradation can compound over 20-30 years. At the same time, today's large TOPCon modules can reduce module count and handling.
The opposite can also be true: if a buyer obtains bankable, properly stored PERC inventory at a steep discount and the project has ample space and a short holding period, PERC may deliver the better NPV. That is why live delivered cost and site-specific simulation are more useful than a generic TOPCon premium table.
Pricing basis note: all prices in this article should be treated as market references unless a current Incoterm, order volume, destination, tax treatment, and quote validity date are stated.
When Should You Switch from PERC to TOPCon? A B2B Decision Guide
Specify TOPCon instead of PERC when the project values high power density, hot-climate performance, bifacial response, long warranty life, or access to current mainstream module supply. PERC can still be commercially rational when discounted inventory creates a meaningful delivered-cost advantage and the project has ample installation area or a short holding period.
This framework applies to new projects and to pipelines that were originally designed around PERC. Because the supply base has shifted sharply toward TOPCon, an older PERC specification should be re-bid rather than automatically carried forward.
Prefer TOPCon When:
-
New project development: TOPCon is now the mainstream shipment technology among major suppliers, so new projects generally have better access to current high-power SKUs, newer BOMs, and longer N-type warranty structures.
-
Hot climate operation: If modules spend significant time above 45-55°C, TOPCon's less-negative Pmax temperature coefficient can reduce thermal losses. Quantify the benefit with the project weather file and exact module data.
-
Project finance required: Re-check the lender's approved-vendor criteria, manufacturer bankability, warranty strength, factory scope, and model/BOM documentation. Technology type is only one part of financeability; do not assume that TOPCon alone satisfies lender requirements.
-
Limited rooftop or ground area: Higher module efficiency can increase DC nameplate capacity per usable area. The exact gain should be calculated from the two proposed module dimensions and the actual layout.
-
Long-term ownership (10+ years): A lower contractual degradation rate becomes more valuable as the holding period increases. Model the specific warranty curves rather than applying a universal lifetime-energy uplift.
Continue with PERC If:
- Meaningful delivered-cost discount: If verified PERC inventory is materially cheaper on the same Incoterm basis, calculate whether the capex saving outweighs TOPCon’s power-density, temperature, bifaciality, and degradation advantages over the actual holding period.
- Very short project horizon: If the project will be decommissioned in under 5 years, the long-term advantages of TOPCon have less time to compound.
- Limited TOPCon supply in local market: Some developing markets still have better PERC availability, though this is changing rapidly.
- Existing PERC inventory: If you have already purchased PERC modules for an ongoing project, there is no reason to discard them.
Inverter and Mounting Compatibility When Switching
Switching from PERC to TOPCon requires verifying compatibility with your balance-of-system components:
Inverter compatibility: TOPCon modules may have different Voc (open-circuit voltage) and Imp (maximum power current) values compared with PERC modules of the same wattage class. Verify the maximum cold-weather string Voc, operating MPPT window, per-input current, short-circuit current margin, and allowable parallel strings against the exact inverter datasheet.
String design: TOPCon's higher power per module means fewer panels per string to reach the same system capacity. This may affect string length calculations and combiner box configuration.
Mounting system: High-power TOPCon modules are often available in larger formats. For example, GINZA's current 620W and 635W product pages list 2465 × 1134mm modules. Verify rail span, clamp zones, allowable load, handling method, roof layout, and local structural requirements. See the Solar Mounting System page for procurement scope.
Connectors and monitoring: Cell technology itself does not require a different monitoring protocol, but connector make/model, current rating, cable size, and inverter input limits must still match the selected module. Avoid assuming universal MC4 interchangeability across connector brands.
Panel choice directly affects string design and inverter sizing. Submit the proposed module and inverter datasheets with your BOM so the electrical window can be checked before order confirmation.
B2B Procurement Guide: How to Source TOPCon Solar Panels
When sourcing TOPCon solar panels for B2B projects, evaluate the exact module and factory, not just the word “TOPCon.” The core RFQ should cover module efficiency, Pmax temperature coefficient, degradation warranty, bifaciality, IEC qualification/safety certification, BOM traceability, factory quality control, warranty execution, logistics, and delivered commercial terms.
This framework is designed for EPC contractors, project developers, distributors, and wholesale buyers who need to compare supplier offers on a like-for-like basis.
TOPCon Procurement Checklist
| Evaluation Criteria | Minimum RFQ Requirement | Stronger Procurement Target | What the Buyer Should Verify |
|---|---|---|---|
| Module efficiency | ≥22% for modern utility/C&I class | ≥23% where space is constrained | Datasheet + third-party power test |
| Module power | Match project layout | ≥600W where large-format modules fit | Dimensions, weight, current, container loading |
| Pmax temperature coefficient | ≤-0.35%/°C | Around -0.30%/°C or better | Model-specific datasheet |
| Year-1 degradation | ≤2% | ≤1.5% | Linear power warranty |
| Annual degradation after Year 1 | ≤0.5% | ≤0.4% | Warranty formula and exclusions |
| Bifaciality factor | ≥80% if bifacial design matters | ≥85% for high-rear-irradiance designs | IEC bifacial rating / test report |
| Product warranty | ≥15 years | 25 years where commercially supported | Warranty entity and claims process |
| Linear power warranty | ≥25 years | 30 years with explicit year-30 retention | Model-specific warranty document |
| Core certifications | IEC 61215 + IEC 61730 | Add destination-specific approvals | Certificate number, model, factory, validity |
| Reliability testing | Standard qualification | PID, salt mist, ammonia, damp heat, UV/LeTID as site requires | Full third-party reports, not logos |
| Factory quality control | Flash + EL inspection | Traceable serial-level QC records | Sample EL/flash records |
| Commercial terms | Clear MOQ, lead time, Incoterm | Flexible mix + defined delivery SLA | Written quotation / contract |
RFQ Key Parameters for TOPCon Panels
Include these parameters in the RFQ so suppliers cannot substitute a lower-spec product after price negotiation:
- Cell architecture: N-type monocrystalline TOPCon or approved equivalent
- Module power and efficiency: define a minimum wattage and minimum module efficiency
- Electrical window: Voc, Vmp, Isc, Imp and maximum system voltage
- Temperature coefficients: Pmax, Voc and Isc
- Bifaciality: minimum rear/front power ratio where bifacial gain is part of the financial model
- Degradation guarantee: first-year loss, annual linear degradation, and end-of-warranty retained power
- Mechanical load: front/rear design load appropriate to wind and snow zone
- Certifications: IEC 61215 and IEC 61730 plus market/site-specific requirements
- Reliability tests: PID, salt mist (IEC 61701) for coastal sites, ammonia where relevant, and UV/LeTID evidence for the proposed BOM
- BOM freeze: require notification/approval before material substitutions that affect cells, encapsulant, glass, backsheet, junction box, or connectors
- Packaging: pallet design, corner protection, container loading pattern, moisture protection, and handling limits
- Warranty entity: identify which legal entity provides and financially backs the warranty
Supplier Evaluation Framework
| Evaluation Dimension | What to Check | Red Flags |
|---|---|---|
| Factory identity | Exact manufacturing site on certificates | Trading-company offer with unclear factory |
| Quality control | EL, flash test, incoming material control, traceability | No serial-level QC evidence |
| BOM control | Approved BOM list and change-control process | Unannounced material substitutions |
| Certification scope | Exact model + factory + current certificate | Generic certificate from another model/factory |
| Warranty execution | Legal entity, claim process, response SLA | Marketing warranty without claims procedure |
| Financial / bankability review | Lender AVL, current BNEF status where relevant, audited strength | Unsupported “Tier 1” logo or outdated listing |
| Lead-time reliability | Capacity allocation, buffer, historical OTD | Unrealistic delivery promise |
| Technical support | Pre-sales string/layout support, post-sales engineering | No technical contact after shipment |
| Logistics | Packaging spec, container plan, insurance, Incoterm | No packaging drawing or damage procedure |
Common Procurement Pitfalls
- Comparing only $/W: a low module price can be offset by lower roof power density, weak warranty, higher BOS, or logistics damage.
- Treating all TOPCon as identical: cell architecture does not eliminate BOM-dependent UV, PID, moisture, encapsulant, glass, or interconnection risks.
- Using logos instead of certificates: verify certificate numbers, covered model, factory address, validity, and test-standard edition.
- Ignoring current and voltage: high-power TOPCon modules can have different current characteristics that affect inverter MPPT input limits, fuse selection, cable size, and string design.
- Skipping EL inspection requirements: micro-cracks can occur during manufacturing, handling, and long-distance ocean shipping. Define pre-shipment EL sampling and packaging standards.
- Assuming “Tier 1” means product quality: bankability lists are not substitutes for technical due diligence, reliability testing, or factory audit.
- Failing to freeze the BOM: require approval for material changes on bankable projects because reliability can change even when the front datasheet remains the same.
Add the final panel specification to your project BOM — see our BOM Checklist for the complete procurement template.
GINZA Solar Product Positioning for This Comparison
The GINZA range currently published on this website includes 580W, 610W, 620W, and 635W N-type bifacial module paths. The confirmed public values are 22.45% efficiency for GIZ580-72, 22.18% for GIZ620-78, and 22.71% for GIZ635-78. The 610W page is explicitly a reference configuration whose final electrical data must be confirmed.
For B2B procurement, attach the latest model-specific datasheet, certificate set, warranty, and packing specification to the RFQ. Confirm certification scope, warranty entity, factory information, electrical limits, bifaciality, temperature coefficients, and degradation terms before tender submission or order.
Explore the GINZA N-type TOPCon solar panel range or request a project quotation with destination, Incoterm, annual volume, and required certificates.
FAQ — TOPCon vs PERC for B2B Solar Projects
What is the main difference between TOPCon and PERC solar panels?
PERC typically uses P-type silicon with rear passivation, while mainstream TOPCon uses N-type silicon with an ultra-thin tunnel oxide and doped polysilicon passivated contact. TOPCon generally offers higher module efficiency, a better temperature coefficient, higher bifaciality, and lower warranted degradation.
Is TOPCon worth the extra cost over PERC?
Usually for new long-life projects, but there is no fixed premium in 2026. Compare current delivered quotes, BOS, usable-area power density, site-specific energy yield, warranty degradation, and financing requirements. Deeply discounted PERC inventory can still win on short-horizon or space-unconstrained projects.
How much more efficient is TOPCon than PERC?
Typical commercial PERC module efficiency is around 20-22%, while current TOPCon commonly sits around 22-24%+. This efficiency difference mainly increases watts per square meter. For two systems that are both exactly 100kW DC, higher module efficiency alone does not create a proportional increase in kWh per installed kW.
What is the temperature coefficient advantage of TOPCon?
Representative TOPCon Pmax coefficients are around -0.29 to -0.35%/°C versus roughly -0.35 to -0.40%/°C for PERC. Using -0.29% and -0.38%, a 55°C module temperature gives about 91.3% versus 88.6% of STC power — a 2.7-percentage-point difference at that operating point.
How long do TOPCon solar panels last compared with PERC?
Many TOPCon products carry 25-30 year linear power warranties with lower annual degradation than legacy PERC products. Compare the exact year-1 loss, annual degradation rate, and end-of-term retained power. Warranty curves are contractual benchmarks; real field degradation still depends on design, BOM, climate, installation, and manufacturing quality.
Should I still buy PERC panels in 2026?
PERC can still make sense when verified legacy inventory is substantially cheaper, the project has ample area, or the asset horizon is short. For most new commercial, industrial, and utility procurement, TOPCon is the safer default because current supply and product development have shifted strongly toward n-type TOPCon.
What certifications should TOPCon solar panels have?
Start with IEC 61215 design qualification and IEC 61730 safety qualification, then add destination- and site-specific requirements. Coastal projects may require IEC 61701 salt-mist evidence. IEC TS 63202-4:2022 covers measurement of LeTID susceptibility in crystalline-silicon photovoltaic cells. Always verify that the certificate covers the exact model and factory.
How do I verify TOPCon panel quality before purchasing?
Request current third-party certificates, model datasheets, warranty documents, flash-test evidence, EL inspection records, approved BOM information, and packaging specifications. For larger projects, add factory audit, pre-shipment inspection, random EL/flash retesting, and a written BOM-change notification requirement.
About GINZA Solar
This guide was prepared by the GINZA Solar team for EPC contractors, installers, distributors, and project buyers comparing N-type TOPCon and PERC module offers. GINZA supplies N-type bifacial solar panel options from 580W to 635W for B2B project procurement.
Product specifications, certification scope, factory details, warranty terms, and bankability requirements can change. Buyers should verify the exact model, BOM, factory, certificate, and warranty entity against current documents before using any value in a financed project or tender.
Request a custom TOPCon panel quotation with project-specific pricing, technical specifications, and delivery terms. Or explore our N-type TOPCon solar panel product line for detailed specifications.
Published by GINZA Solar | Technical reference for B2B solar procurement professionals
Primary technical references used in the 2026 revision: Fraunhofer ISE Photovoltaics Report (14 July 2026); Fraunhofer ISE TOPCon UV-degradation research (2025); InfoLink 2024 module/cell shipment rankings; InfoLink PV spot-price update (15 July 2026); IEC 61215 / IEC 61730; IEC TS 63202-4.
External Reference Notes
- Fraunhofer ISE, Photovoltaics Report, version 14 July 2026: https://www.ise.fraunhofer.de/en/publications/studies/photovoltaics-report.html
- Fraunhofer ISE, UV testing and degradation in commercial TOPCon modules, 10 April 2025: https://www.ise.fraunhofer.de/en/press-media/press-releases/2025/fraunhofer-ise-evaluates-common-uv-tests-for-topcon-modules-for-practical-relevance.html
- InfoLink, 2024 global module shipment ranking: https://www.infolink-group.com/energy-article/solar-topic-2024-global-module-shipment-ranking-significant-gaps-between-tiers
- InfoLink, PV spot price update, 15 July 2026: https://www.infolink-group.com/energy-article/pv-spot-price-20260715
- IEC TS 63202-4:2022, Measurement of LeTID of crystalline-silicon PV cells: https://webstore.iec.ch/en/publication/67612