
Quick answer. Set solar panel cleaning frequency using measured or defensible site soiling losses, the energy that cleaning can recover before the next natural or planned cleaning, and the full cost of the work. A fixed monthly schedule can be too frequent at one site and too late at another. Identify the cause of lost output first, then use the module manufacturer’s approved cleaning method and the site’s safe access procedure.
This worksheet is for a commercial array owner planning an O&M budget or comparing service bids. It separates a clean-versus-soiled comparison from a simple observation that the inverter produced less energy. Its financial values are fictional screening assumptions.
Separate soiling from other causes of lower output
Dust, local pollution, bird deposits and other contamination can reduce the light reaching cells. The pattern can vary between roof zones and across the face of a module. Rainfall, tilt, nearby roads, vegetation, construction and agricultural activity can change how deposits accumulate or wash away. A site average can hide a small area with persistent contamination.
Lower production can also result from different weather, new shading, equipment outages, clipping, export curtailment or sensor problems. Review those effects before assigning the difference to soiling. Keep irradiance, temperature, inverter availability and relevant alarms with the energy record. The inverter clipping worksheet and export-control guide describe two limits that cleaning cannot remove.
Use a comparison with a defined measurement basis
A properly designed soiling station compares suitable clean and soiled reference devices under comparable exposure, with the corrections and maintenance required by its method. Other approaches use matched array sections or performance models. Have the O&M provider define the method, sensor locations, calibration, cleaning log and quality checks. Avoid treating one uncorrected daily energy difference as a measured loss.
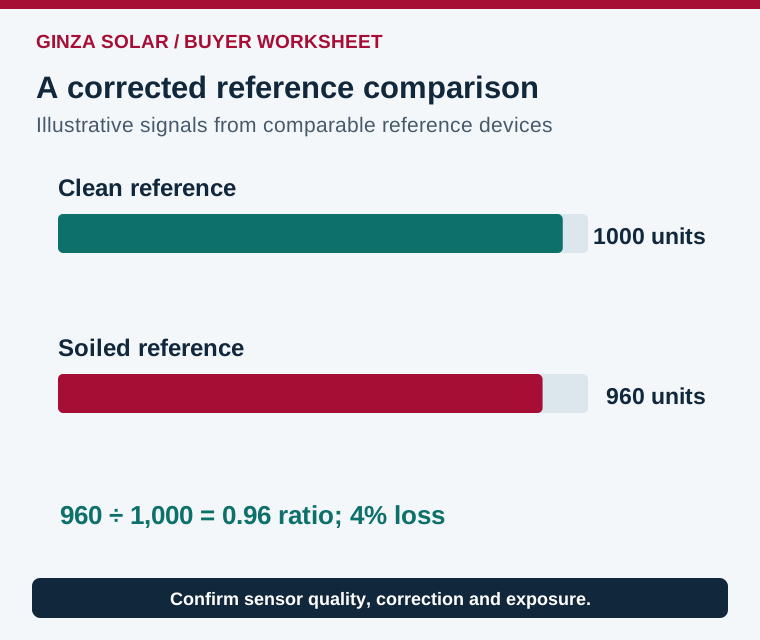
For illustration, a corrected clean-reference signal of 1,000 units and a matched soiled-reference signal of 960 units give a soiling ratio of 0.96 and an implied loss of 4% on that basis. The signals must be comparable. A dirty irradiance sensor can also distort the assessment, so state how the reference devices and sensors are maintained and how gaps or anomalous readings are handled.
| Evidence to collect | Use in the decision | Check before accepting it |
|---|---|---|
| Soiling measurement or corrected comparison | Estimate recoverable loss by array zone | Sensor suitability, location, calibration and data quality |
| Production and operating logs | Separate soiling from outages and curtailment | Same timestamps and relevant equipment status |
| Weather and site activity | Identify deposition and potential natural cleaning | Rain timing, construction, traffic and seasonal changes |
| Cleaning work scope | Calculate the complete intervention cost | Access, labor, equipment, water, downtime and inspection |
Worked example: value the recoverable energy window
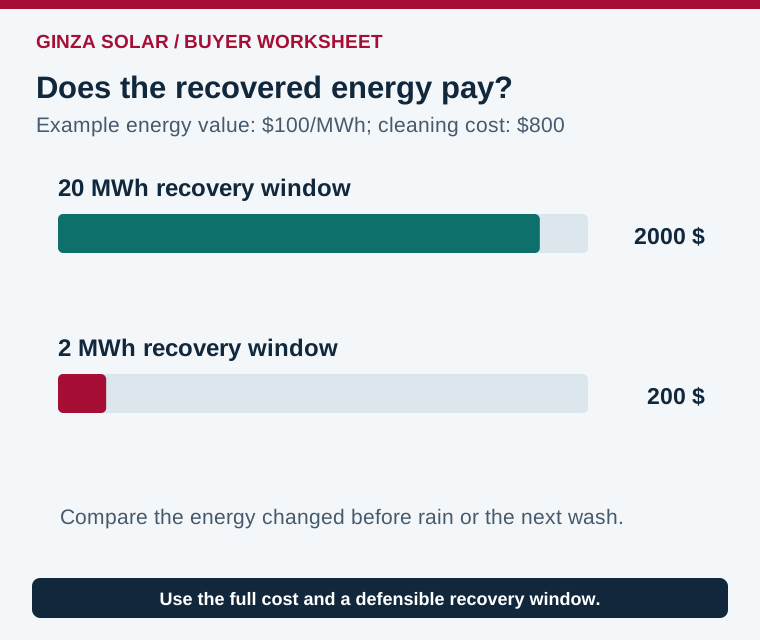
Assume a site is expected to generate 500 MWh of clean-equivalent usable energy over the decision window. If a 4% loss would persist through that entire period without cleaning, the potential recovery is 20 MWh. At an assumed value of $100 per MWh, gross benefit is $2,000. Subtracting an $800 cleaning cost leaves an illustrative $1,200 benefit before other effects.
Now assume forecast rain or another intervention would remove the same contamination much sooner, leaving only 2 MWh of recoverable energy before that event. The gross value falls to $200 and the same $800 cleaning costs $600 more than the recovered energy is worth in this narrow calculation. Real rain may only partly clean the modules. Use scenarios for timing and effectiveness instead of assuming every rainfall restores a clean surface.
Break-even check. At the example’s fixed $100/MWh energy value, an $800 intervention needs 8 MWh of additional usable energy to cover its cost. Over the assumed 500 MWh clean-equivalent window, that equals a 1.6% recoverable loss. This threshold assumes cleaning restores that entire loss and the energy is usable; revise it for partial cleaning, curtailment or time-varying energy value. The IEA PVPS soiling report provides the wider measurement and economic context.
Use the value of energy at the hours when it can be recovered. At a site with an export cap or full battery, some additional PV may be curtailed. A self-consumed kWh and an exported kWh can have different values. For a bifacial array, account for the actual surfaces and rear-side model. The bifacial gain guide explains why light and geometry need a consistent comparison.
Break the cost into mobilization and work that varies with area. If access equipment and crew travel are already scheduled for another approved task, the incremental cleaning cost can differ from a dedicated visit. Record that allocation transparently. Conversely, a quoted wash price may omit temporary shutdown, water delivery, access supervision or work needed to protect surrounding equipment. Include the actual owner cost in the comparison.
Use a decision window consistent with the evidence. A measured loss today need not remain constant for three months. Compare a dry-period accumulation case, a partial-rain recovery case and a rapid natural-cleaning case, then see whether the decision changes. If it does, obtain better weather or soiling information before committing. This is especially relevant where one dusty perimeter zone and a cleaner central zone would otherwise be averaged into a single whole-site number.
Agree a method that preserves the equipment
Obtain the exact module cleaning instructions and the site’s approved work plan. Ask the service provider to identify permitted water quality, tools and contact methods, the conditions when cleaning can proceed, electrical safety arrangements and access or fall-protection responsibilities. Have the owner and relevant contractors resolve warranty, roof membrane, drainage and water-management constraints before scheduling the work.
Localized deposits or visible damage may need assessment even when the whole-array energy calculation favors waiting. Have a qualified person investigate abnormal patterns, hot spots or suspected electrical damage under the approved procedure. A cleaning crew should know how to stop and report those findings. Preserve photos, location and module identifiers for follow-up rather than attributing every defect to dust.
Build a schedule that can change with evidence
Start with a monitored period spanning the site’s relevant seasons or deposition events. Compare the measured soiling trend with the O&M assumptions and record how much each cleaning actually recovers. Adjust the decision threshold for zones with different exposure. If a nearby construction project ends or a surface changes, revisit the expected rate instead of retaining the same schedule indefinitely.
Ask the contractor to provide the pre-work condition, completed area, method, water and access records, observed defects and post-work comparison. Use comparable irradiance and operating periods for the recovery assessment. A sunny day immediately after a cloudy pre-clean day is not an energy-performance test. Agree who reviews uncertain results and how the evidence will inform the next maintenance cycle.
Questions to include in an O&M quotation
- Which array zones and surfaces are included, and how is the need for intervention established?
- What module-approved method, access arrangement and equipment are proposed?
- What costs, downtime, water supply and disposal responsibilities are included?
- How are abnormal module or wiring conditions escalated and recorded?
- What measurements show recovery, and what triggers a change in the schedule?
Frequently asked questions
How often should commercial solar panels be cleaned?
Use site evidence, energy value and the approved method to set an interval or trigger. Reassess it when seasons, site activity or surface conditions change.
Will rain clean the array completely?
Effectiveness depends on the deposit and installation. Compare measured conditions before and after rain and include uncertainty in the maintenance decision.
Does every drop in yield mean dirty panels?
Check weather, shade, availability, equipment limits and sensors. Diagnose the cause before assigning the difference to soiling.
What should a cleaning service report?
Require the work area, approved method, condition and defect records, and a comparable pre/post assessment tied to the site’s monitoring.
References and project quotation
- IEA PVPS report on soiling mechanisms, measurement and economics
- DOE FEMP guidance on PV operation and maintenance
For a new project, compare GINZA module options and request model-specific documentation with the site environment and proposed maintenance arrangement.