
Quick answer. Battery state of charge (SOC) describes how full the battery is under the estimator’s definition. State of health (SOH) describes its condition relative to a defined reference. One common capacity-based SOH compares present measured capacity with beginning-of-life capacity under comparable conditions. A battery can show 100% SOC and still deliver less energy than it did at commissioning. Ask how each number is defined before using it to estimate backup runtime.
The Sandia energy storage management handbook chapter discusses SOC and SOH as separate storage states. SOH is a broader concept than capacity alone and can incorporate power capability or other measures depending on the manufacturer. For a commercial purchase, write down what the displayed value means, the relevant boundary and how the contract verifies usable storage. A percentage without its denominator cannot specify deliverable kWh.
Identify the numerator and reference before using either value
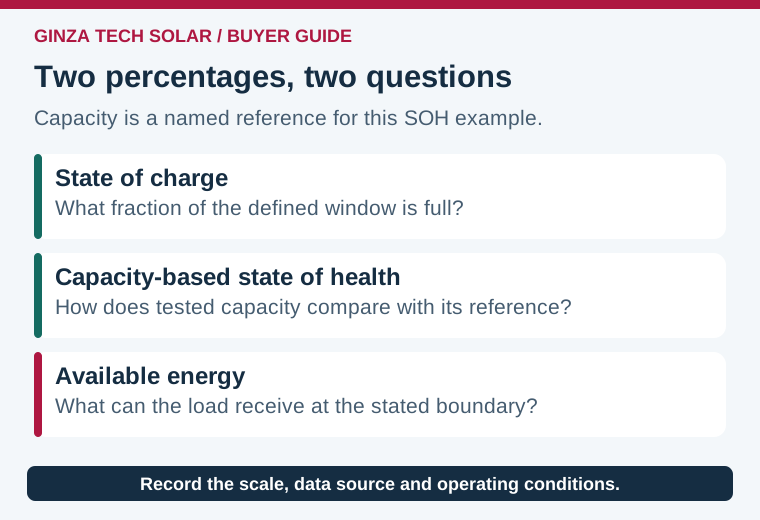
| Signal | Question it helps answer | What to request |
|---|---|---|
| SOC | How full is this defined battery window now? | Origin, scale, estimate method, valid range and update time |
| Capacity-based SOH | How much capacity remains versus a named reference? | Reference, test conditions, age, and whether the figure is measured or estimated |
| Available discharge power | Can the system serve an instantaneous load? | Limits in kW at a named boundary and current conditions |
| Delivered usable energy | How much energy can the load receive? | Meter boundary, start and end states, auxiliary treatment and test method |
Ask whether SOC is given for a rack or the whole system, and whether the system’s presented 0–100% corresponds to the manufacturer’s usable window or a different estimator definition. Different interfaces can display different SOC values legitimately. One might be a rack reading, another an aggregation and another an external monitor’s independent estimate. Map them to their data sources before changing a controller or accepting a fault diagnosis.
Worked example: why the reserve and boundary matter
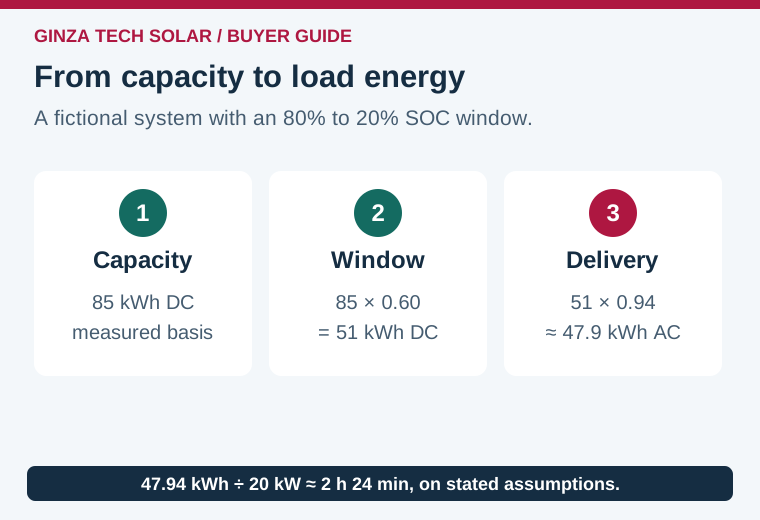
Suppose a fictional battery bank began with 100 kWh of measured DC capacity and now has 85 kWh under the same test rate, cutoffs and temperature. Capacity-based SOH on that basis is 85%. The control system reports 80% SOC on a scale corresponding to the current energy capacity for this example. The dispatch rule stops normal discharge at 20% on the same scale, so its estimated energy window is 60 percentage points. On the stated assumptions, the available DC energy is 85 × 0.60 = 51 kWh.
In an actual battery, SOC may be based on charge in amp-hours while operating voltage changes during discharge. Equal SOC steps therefore need not represent equal amounts of energy. The proportional energy calculation here is an explicit screening assumption. For a guaranteed reserve, use the supplier’s supported energy-versus-SOC model or a measured usable-energy result at the required rate, temperature and stopping conditions.
With an illustrative 94% net conversion factor covering the losses represented in this example, the corresponding AC energy at the load is about 47.9 kWh. At a constant 20 kW, the arithmetic runtime is 47.94 ÷ 20 = 2.397 hours, or about 2 hours and 24 minutes. This assumes sustained power, no further reserve change and the stipulated efficiency and auxiliary boundary. If the contract already provides usable AC kWh at its specified meter, do not deduct the same losses again. The calculation is not a product guarantee.
For critical loads, check the actual initial and stopping SOC, temperature, battery power limit, usable window, measured or assumed conversion and sustained load. An estimate that assumes full charge can be misleading if a site frequently begins outages partway through a dispatch cycle. Capture the site’s normal SOC history and reserve policy. The critical-load backup sizing guide connects the window to the load schedule, and the C-rate worksheet explains the independent power constraint.
Compare the same example with a 60% initial SOC and the same 20% stop. The window drops to 40 percentage points. Under the same fictional assumptions, 85 × 0.40 × 0.94 gives 31.96 kWh AC, which lasts about 1 hour and 36 minutes at 20 kW. The difference arises from the starting point, with no implied change in battery condition. If the load alternates during the outage, check energy over each interval and verify that momentary power requirements stay within the approved equipment capability.
Check a drifting reading before diagnosing degradation
SOC can be estimated by integrating measured current over time, with additional corrections or model logic depending on equipment. A biased sensor, current path outside a shunt, incorrect capacity setting or missed synchronization can produce a misleading display. Victron’s SmartShunt troubleshooting manual gives concrete examples for that monitor, including incomplete current paths and inconsistent synchronization settings. Other equipment can use different methods. Consult its manual and verify how external readers receive or estimate SOC.
Check the time of the reading, communication state and whether the displayed value comes from the BMS, inverter, EMS or an independent instrument. Review logs against a known operating period and ask whether the estimated value stabilizes following an approved reference event. Consider configuration changes, measurements and the available temperature data before inferring actual capacity loss. If the percentages disagree, document their definitions and resolve sign, time and scope before calling for corrective action. Do not set endpoints or protections based on an assumed discrepancy.
Think through how the display behaves after a rack is added or temporarily unavailable. A whole-system estimate may reflect a smaller accessible bank while an individual rack retains the same charge. Ask the vendor how it aggregates online capacity, handles unavailable data, and indicates a configuration change. A service report should log module or rack identities and firmware so a future comparison can distinguish equipment configuration from aging.
Verify capacity with evidence that matches the claim
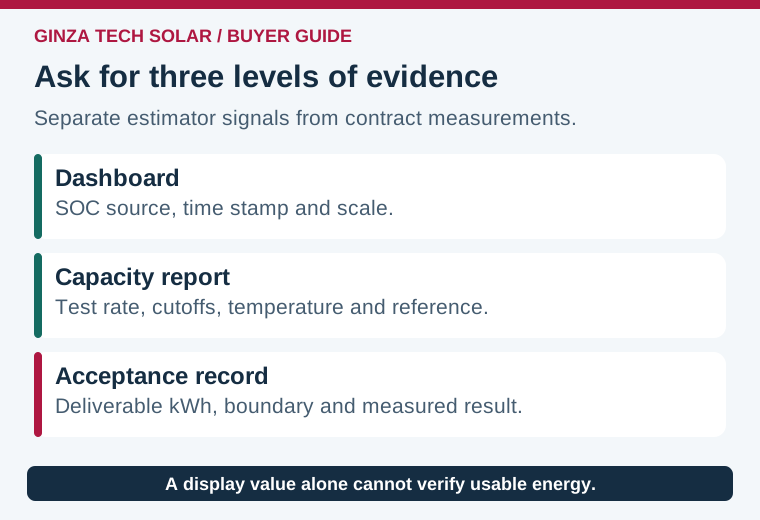
For a capacity submission, ask for the meter position, starting condition, cutoffs, load, temperature, auxiliary treatment, firmware and readings from the run. Compare similar results against the same reference and record uncertainty where relevant. A short demonstration at low power cannot fully establish sustained capability at a higher load or measure the usable energy from end to end. Likewise, a one-time SOH display does not substitute for the performance evidence specified in the purchase.
When a buyer asks for both guaranteed power and guaranteed delivered energy, use two measurable requirements and specify whether they must be achieved together. Have the supplier identify any condition that can reduce one while the other remains available. The usable AC energy acceptance guide describes the importance of measurements at the agreed boundary.
When comparing successive tests, log the date, starting state, stopping event, meter serial, elapsed time, rate, temperature and test boundary. Have the supplier explain any change in cutoff or permitted operating range. Those changes can alter measured deliverable energy even if the cells have not changed materially. A trend becomes easier to interpret if each run also identifies any disabled racks and records whether the project included auxiliary consumption at the selected meter.
Before a storage purchase, turn these questions into a short evidence schedule. Request a usable-energy result under stated conditions, a description of how SOC and SOH are reported, a reserve example using the proposed control scheme, and a sample timestamped data export. Agree who can interpret or revise the estimator settings and what event triggers a reference test. This gives procurement, commissioning and operations a common vocabulary without asking them to treat a display icon as a measurement.
For a project review, compare GINZA 51.2 V battery options and send the backup load, reserve assumptions, proposed model and meter boundary. Include displayed SOC and SOH definitions, known data gaps and any acceptance evidence already available.